 and
and  list the following information
for the filters of each channel:


Tables  and
and  list the following information
for the filters of each channel:
 m, of the transmission
curve
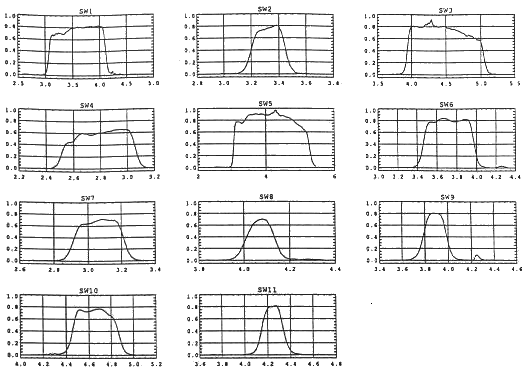
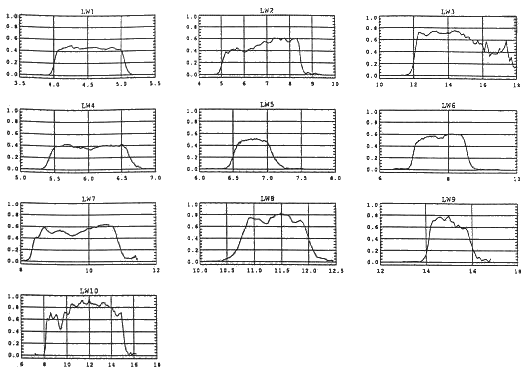
Figures  and
and  give the spectral
transmission (Filter transmission
  detector response) of
the filters.
A detailed report on the blocking of the filters is given in appendix
 .
.

Figure: Spectral transmission of ISOCAM for SW filters. The detector
efficiency
has been normalized to 1 at 4  m.
m.

Figure: Spectral transmission of ISOCAM for LW filters. The detector
efficiency
has been normalized to 1 at 9  m.
m.