

The basic formula that governs the sensitivity calculations is the definition of the signal-to-noise ratio, S/N:
P is the power illuminated on the detector and depends on the measurement mode and the flux of the source.
 is the noise equivalent power determined as the total
of all noise source
contributions along the signal chain. Noise sources are:
t is the integration time. The factor of 2 results from sampling theory; detector signals are derived from the slope of the integration ramps using several non-destructive read-outs (for explanation of read-out technique see section 2.6)
The values of the power P and  depend on the observing
mode, such as photometry with PHT-P and PHT-C, spectrophotometry, maps,
polarimetry and observations during slews.
From Equ. 4 the integration time becomes:
Note that Equ. 4 and 5 assume a constant source signal, i. e. detector drift effects have not been taken into account. Therefore, these equations should only be considered as an approximate estimate of the detection limits attainable rather than an exact measure of photometric accuracy.
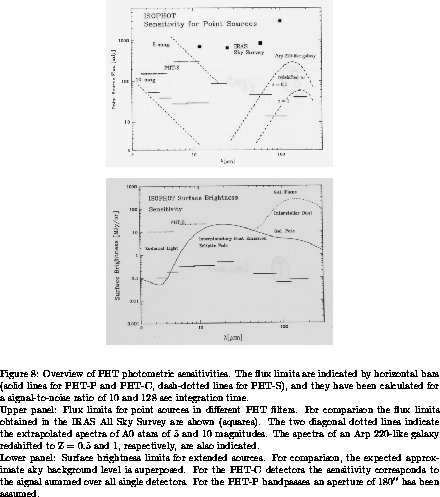
Fig. 8 gives an overview of the photometric sensitivities that can be reached in 128 sec for a detection with a signal-to-noise ratio of 10.
In the individual AOT sections in Chapter 6 the total
power P and the different noise
sources contributing to  are considered, and Equ. 5
is used for the calculation of integration times.