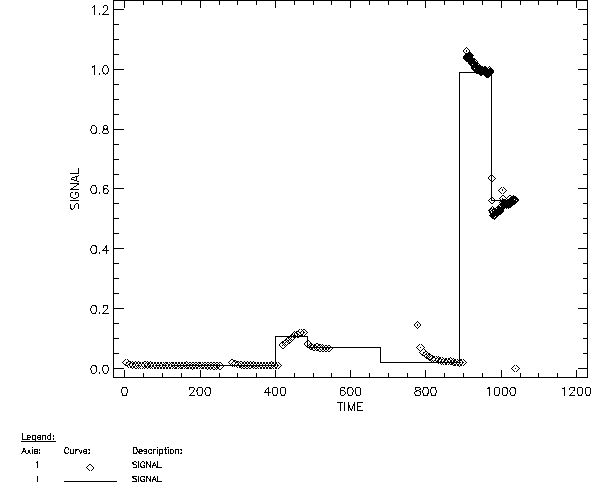
The P_25 signal variation in V/s as a function of time in sec for
two consecutive P05 observations. The 7 different measurements can clearly be
distinguished. The solid line represents the derived average signal level
(after removal of drifting signals) for each measurement.