M.G. Breitfellner, I. Heinrichsen, A. Heras, A. Biviano, A. Moneti
ISO Science Operations Centre, ESA Satellite Tracking Station, Villafranca del Castillo, P.O. Box 50727, E-28080 Madrid, Spain.
A comparison of PHT-P photometry out to 100 um, PHT-S spectrophotometry, an SWS AOT1 speed 4 spectrum, two CAM LW CVF2 scans, a composite spectrum from M. Cohen (used as reference) and IRAS data (PSC and LRS) is presented to reflect the status of CAM, PHT, and SWS flux calibration as of February 1997.
The SWS spectrum agrees well with the composite spectrum assembled from
ground-based and KAO observations (M. Cohen et al. 1995). Deviations are in
general smaller than 5 %. There remains a discrepancy between the ends of band
2C and 3A (around 12 um).
The CAM CVF2 spectrum matches the composite spectrum of Cohen et al.
extremely well. Deviations are always less than 3 %, from 9 to 16.5 um.
With the exception of the last dozen points the PHT-SS (short wavelength part)
spectrum matches well with the SWS and the composite spectra.
The PHT-SL (long wavelength part) is 20 % below the reference spectrum around 7
um and lies 20 % above the reference spectrum around 11 um.
PHT-P1 filter measurements are now in good agreement (< 10 %) with the
SWS and composite spectra for wavelengths smaller than 15 um when the data
was processed with PIA V5.4 (Cal-G V2.4). The P1_16.0 filter suffered from
drift effects because it was the first in the series of the multifilter
sequence performed on HR6705.
P2_20 and P2_25 filters deviate by 20 % and 60 % respectively.
This memorandum reflects the status of CAM, PHT and SWS flux calibration as of February 1997. Data obtained with these three instruments when observing the standard star HR6705 (gamma Draconis) are compared with a composite spectrum assembled from ground-based and KAO observations (Cohen et al. 1995), data from the IRAS Point Source Catalogue (PSC) and an IRAS Low Resolution Spectrum (LRS). The Cohen spectrum will be used as a reference hereafter. It is interesting to note that it was also used together with data from other standard stars to derive some of the calibration files.
HR6705 was also observed by LWS on rev. 168. For LWS there is not enough detectable flux left for the detectors LW3, LW4 and LW5 at the longest wavelengths. At the shorter wavelength, detectors SW1, SW2, LW1 and LW2 are affected by a filter leak and don't give reliable results suitable for a comparison. For SW3, SW4 and SW5 the noise is of the same order than the signal and hence the quality of the results is not sufficient for a comparison.
The PHT-S spectra were obtained during Performance Verification (PV) phase on revolutions 25 and 57 where a series of PHT-S spectra was obtained on HR6705. The data presented here are Auto Analysis Results (AAR) derived with Off Line Processing (OLP) V6.0. The RSRF and the conversion to absolute flux values was obtained from several standard stars (for details see ISOPHOT PV-Calibration Report).
The PHT-P filter measurements were taken mainly on revolution 356. The measurements with the P1 filters 3.60 and 16.0 suffered from strong drift effects and were repeated on revolution 398 with a longer integration time (64 s instead of 32 s). The P1_16.0 filter is now only 25 % off (see Fig. 2.) compared to a factor of 2 before. The data were processed with PIA V5.4 starting from ERD-level following the standard reduction scheme which includes:
The final results derived with PIA are given as flux density assuming a flat spectrum (Fnu = const. ) at the filter "central wavelength" as defined in the ISOPHOT Observer's Manual. The conversion from instrumental (Watt) to astrophysical units (Jy) was derived by using several calibration stars at short wavelengths, and asteroids, at long wavelengths (for details see ISOPHOT PV-Calibration Report).
The resulting values were colour-corrected using the correction factors for a black-body with 2500 K (spectral type of HR6705 is K5III). These factors can be found in chapter 5.2.5.2 of the ISOPHOT PV-Calibration Report issue 1.5 11-12-1996. The results of the PHT-P multifilter measurements can be found in Table 1.
The SWS spectrum was observed on revolution 377 (AOT01, speed: 4, 2.4 - 44.5 um). The Standard Processed Data (SPD) processed with OLP V5.2 was retrieved from the archive. The final result was derived with SIA using the calibration files which were in the TEST directory on 17-01-1997. The versions of these files are the same as in OLP V5.2 except for SC13_013 which was used instead. Data from detectors 30 and 36 (band 3) were discarded due to their high noise and bad behaviour during part of the observation. The resulting AAR was processed with SWS_FLATFIELD (default values but for band 2C, in which the option /noupdown was used), SIGCLIP (default values) and SWS_REBIN (resolution 400). The RSRF for band 3E was derived from in-orbit measurements on NML-Cyg. For all other bands it was derived before launch during the Instrument Level Test (ILT). Flux calibration is derived from several bright standard stars (Schaeidt et al. 1996). For details of the Wavelength calibration see Valentijn et al. (1996).
The CAM spectrum was observed on revolution 482 (AOT CAM04), with the LW CVF2, from 9.00 um to 16.52 um, by sampling one every two CVF2 positions. Two consecutive scans were done, the first in increasing wavelength, and the second in decresing wavelength. The RSRF was derived from HIC94890, HIC96441 and delta Draconis which are between 7 and 70 times fainter than gamma Draconis. As HR6705 is a very bright source for CAM, it was not possible to observe it with CVF1 at shorter wavelengths, i.e. because it would saturate the detector. For the same reason, a very low sensitive configuration had to be chosen even for the CVF2 observations, i.e. gain=1, and integration time of 0.28 seconds. Per each CVF position, 100 frames were taken, for a total dedicated time of 2358 seconds.
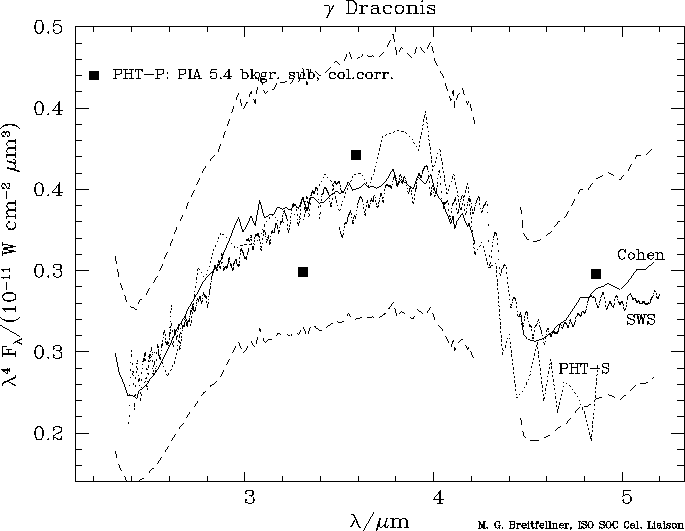
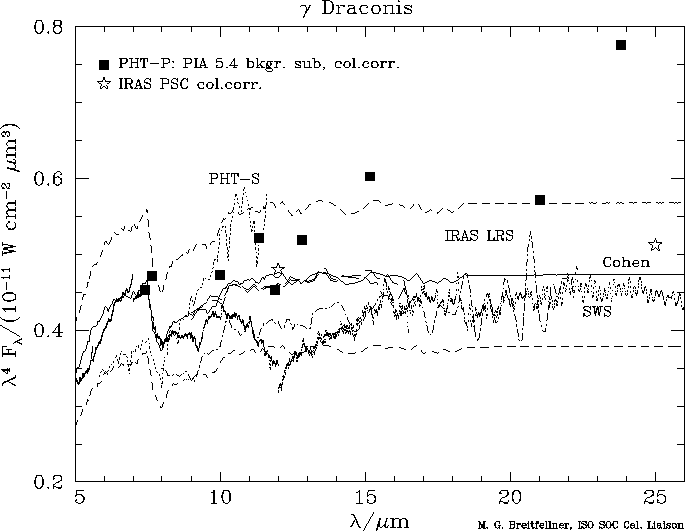
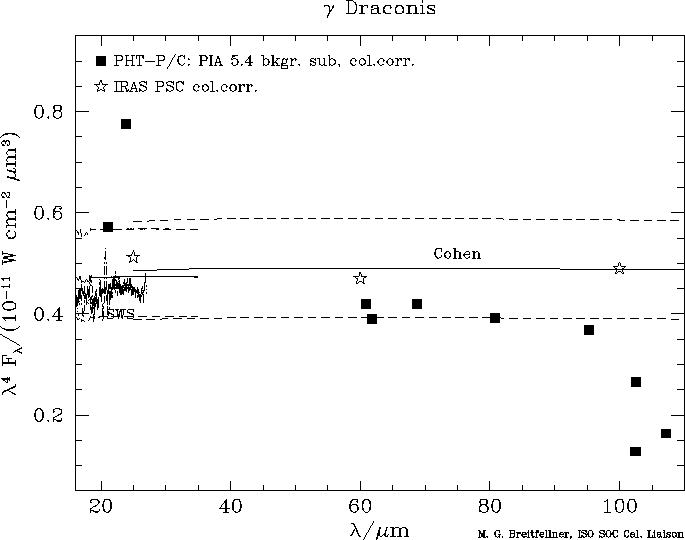
Figures 1 to 3 show a plot of the data obtained on HR6705 with PHT and SWS compared to a composite spectrum assembled from ground-based and KAO observations (Cohen et al. 1995). Results are plotted in lambda4 Flambda space in order to clearly show the differences.
In all plots the SWS spectrum is represented by points derived from a rebinning of the spectrum at resolution 400 while the two PHT-S spectra are represented as dotted lines. The CAM spectrum is plotted as a long-dashed line. PHT P and C filter measurements are represented by filled squares and are summarized in Table 1. The Cohen composite spectrum is drawn as a reference spectrum represented by a solid line with two parallel dashed lines indicating an offset of ± 20 %. From the IRAS mission the colour corrected values of the Point Source Catalogue are represented as open stars and the Low Resolution Spectrum is plotted as dashed-dotted line.
In Fig. 1 (wavelength range 2.4 - 5.2 um) it can be clearly seen that the SWS spectrum matches in this wavelength range very well the composite spectrum (< 5 %). Also the PHT-SS spectrum follows quite well to the composite spectrum with the exception of a small bump at 3.8 um and the last 12 points which are off by about 10 - 20 %. PSF effects could also have an effect. The PHT-P filter measurements agree within 10 % with the spectra.
At longer wavelengths (5 - 26 um), shown in Fig. 2, the agreement is
less good. Although the SWS spectrum matches in general the composite spectrum
(deviations < 10 %), there is a problem with the edges of band 2C
and 3A around 12 um which are lying aproximately 25 % below the reference
spectrum. The discrepancy is related to the RSRFs for these bands, which were
derived from a fully extended thermal source in the laboratory. Point-source
corrections to the RSRFs result in excellent continuity between 2C and 3A, and
agree with the Cohen composite spectrum to within 10 %. The improved
calibration files will be available soon in SIA.
Fringing can be seen in the SWS spectrum From 20 um towards longer
wavelengths. There was no attempt made to correct for this effect because it
was not considered necessary for this comparison. The tools to treat fringes
are now available within SIA.
The CAM spectrum agrees with the composite spectrum over all the range of
observed wavelengths (9 to 16.5 um). The maximum deviations seen are at the
long wavelenght edge position of the CVF2 (7 %) and at around 11 um (3 %);
there is no average systematic deviation and the rms deviation is only 2 %.
The PHT-SL spectrum deviates by 20 % from the composite spectrum being too
low at the short wavelengths and being too high at the long wavelengths.
The PHT-P1 filter measurements agree within an accuracy of 10 % with the
spectra with the exception of the P1_16.0 filter. This filter was
chosen automatically by the AOT/OTC logic to be the first in the series of this
P1 multifilter measurement because it was expected to be exposed to less flux
than the other P1 filters. Since stabilization times for the P1 detector
are shorter changing from low to higher flux levels than from high to lower
fluxes, multifilter observations should always be done starting at small flux
levels and moving to greater fluxes. Being the first of the multifilter
measurement series the P1_16.0 suffered from drift effects which could not
be corrected completely (drift modeling was not yet available in PIA at the
time of the data processing).
The results of the P2_20 and P2_25 filters are off by 20 % and 60 %
respectively lying well above the SWS and the composite spectrum.
Finally at the very long wavelengths (20-105 um) as shown in Figure 3 the PHT-P3 and C100 filters give results approximately 20 % below the Cohen model. For longer wavelengths the values are off by 40 %. This can be partly explained by the fact that at these wavelengths the flux level of the observed source is only around 1 Jy. To measure similar flux levels at those wavelengths a different observation strategy would normally be applied: each background measurement should be done immediately before the on-source measurement allowing more time for the detector to stabilize. Another possibility would be to perform a miniraster to obtain better detector stability and flatfielding. In this case all background and then the on-source measurements were done allowing the detector to drift in the mean time.

Fig. 1. Observations of HR6705 in the wavelength range 2.4 - 5.2 um using the following ISO (sub)instruments: The SWS spectrum is represented by points derived from a rebinning of the spectrum at resolution 400 while the PHT-S spectrum is represented as dotted lines drawn between the individual pixels of the array. PHT P and C filter measurements are represented by filled squares and are summarized in Table 1. The Cohen composite spectrum is drawn as a reference spectrum represented by a solid line with two parallel dashed lines indicating an offset of ± 20 %. From the IRAS mission the colour corrected values of the Point Source Catalogue are represented as open stars and the Low Resolution Spectrum is plotted as dashed-dotted line.

Fig. 2. Same as Fig. 1 for wavelength range 5 - 26 um. The two CAM-CVF scans from 9 to 16.5 um are represented by long-dashed lines.

Fig. 3. Same as Fig. 1 for wavelength range 20-105 um.
PHT-P and C100 multifilter measurements
  1.      2.    3.        4.     5.        6.     7.        8.     9.
                        src+bckgr IA      source IA       col. corr.
det_fltr wavelength   flux dens. err   flux dens. err   flux dens. err
        [micron] dl     [Jy]     [Jy]    [Jy]     [Jy]    [Jy]     [Jy]
------------------------------------------------------------------------
P1_3.29   3.30  0.22   1061.6    2.07   1061.5    2.07   1062.6    2.07
P1_3.60   3.59  1.00   1100.8    1.49   1100.8    1.49   1081.3    1.46
P1_4.85   4.86  1.55    512.94   0.75    512.94   0.75    491.33   0.72
P1_7.30   7.43  3.38    301.99   0.39    301.96   0.39    276.01   0.35
P1_7.70   7.64  0.84    271.50   0.47    271.48   0.47    268.00   0.47
P1_10.0   9.99  1.86    160.77   0.34    160.14   0.34    157.78   0.34
P1_11.3  11.36  0.77    137.02   0.32    136.23   0.32    134.88   0.32
P1_11.5  11.89  6.51    126.39   0.25    125.63   0.25    106.92   0.22
P1_12.8  12.83  2.33    107.90   0.13    106.61   0.13    105.25   0.13
P1_16.0  15.14  2.86     90.824  0.39     89.31   0.39     87.39   0.38
P2_20    21.08  9.43     51.042  0.11     48.157  0.11     43.074  0.099
P2_25    23.81  9.18     52.548  0.10     49.206  0.19     45.646  0.17
P3_60    60.06 25.48      8.304  0.084     4.301  0.10      3.776  0.091
P3_100  101.63 40.15      3.759  0.040     0.446  0.056     0.406  0.051
C1_50    67.3  57.8       4.599  0.88      4.048  0.88      2.968  0.65
C1_60    60.8  23.9       4.348  0.83      3.824  0.83      3.415  0.74
C1_70    80.1  49.5       2.881  0.55      2.383  0.56      1.999  0.47
C1_90    95.1  51.4       2.142  0.41      1.735  0.41      1.352  0.32
C1_100  103.5  43.6       1.433  0.27      0.962  0.29      0.843  0.25
C1_105  107.0  37.4       1.007  0.19      0.518  0.21      0.475  0.20
------------------------------------------------------------------------

IRAS Point Source Catalogue for comparison
------------------------------------------------------------------------
         12                              155.1            111.2
         25                               37.84            27.32
         60                                5.706            4.356
        100                                1.782            1.634
------------------------------------------------------------------------
Table 1.
This table contains the results of the PHT-P and C100 multifilter
measurements on HR6705. The columns represent:
1. name of detector and filter;
2. central wavelength of filter (see ISOPHOT Observer's Manual) in
micron;
3. filter width in micron;
4. source + background flux density in Jansky from processing with PIA V5.4;
5. corresponding statistical error;
6. source flux density in Jansky after background subtraction;
7. corresponding statistical error;
8. source flux density in Jansky colour corrected using correction factors
for a black-body with 2500 K as published in the ISOPHOT
PV-Calibration Report;
9. corresponding statistical error.
For comparison the values from the IRAS Point Source Catalogue are shown
in the lower part of the table.
For the short wavelengths (2-20 um) the photometric accuracy obtained by CAM, SWS and PHT is matching (or very close to) the pre-launch specifications stated before the beginning of the mission.
SWS gave 30 % of expected accuracy for their photometric absolute calibration and 10 % for the relative calibration in the ISO-SWS Observer's Manual (p.24). With the exception of the ends of band 2C and 3A their spectrum in general does not deviate more than 5 % from the composite spectrum (Cohen et al. 1995) which is used as reference in this comparison.
The CAM spectrum is within 2 % rms from the composite spectrum; this result provides good confidence in the accuracy of the CVF calibration, although we must stress that this source is very bright and therefore not typical for CAM. Fainter sources are generally affected by transient problems. The maximum deviation between the CAM and the composite spectra (7 %) occurs at the last CVF step position (16.5 um), where the spectral response function may still be far from perfect, because the calibrator fluxes are low. New measurements will be added in the next future to improve on this point.
Also the PHT-SS spectrum matches the reference spectrum except for a small bump
at 3.8 um and the last 12 points which are off by about 10 - 20 %. This is
already very close to the original specification concerning absolute photometry
(10 %).
The match of the PHT-SL spectrum is less good (deviations of about 20 %).
More PHT-S data have to be analyzed in detail to understand the peculiar
behavior of these detectors.
PHT-P filter measurements are now in good agreement (< 10 %) with the
reference spectrum for wavelength shorter than 15 um. This meets the
specifications of 10 % of accuracy for absolute photometry as quoted in the
Science Capabilities of the ISO Payload document (p.39). The 5 % of
accuracy for relative photometry is not yet achieved.
A major problem are drift effects which can affect considerably the accuracy of
measurements as seen here for the P1_16.0 filter. It has to be checked if this
can be corrected by drift modelling or if it can be avoided by changing the way
the observation was done (e.g. longer integration times of 128 s to give the
detector more time to stabilize).
For longer wavelengths (15-105 um) the results from the PHT filter measurements
are still off by 20 % to 60 % which is probably due to the drifts induced by
the observing strategy which was not optimal for this kind of observations.
Although this comparison is only based on observations of one bright star, it shows that calibration of ISO (sub)instruments is progressing and converging. With each new release of calibration files precision of calibrated data is increasing.
Acknowledgements. This work would not have been possible without the extensive work of many in the instrument teams who have developed the instruments, defined the calibration plans both in the laboratory and in orbit, executed those plans, and analysed the data.