A large number of astronomical sources observed with SWS were also
detected by IRAS in the 12 and 25 ![]() m bands and are included in the
IRAS Point Source Catalogue.
m bands and are included in the
IRAS Point Source Catalogue.
In order to compare the absolute flux calibration of IRAS and ISO SWS
we searched the ISO Data Archive for observations made with ISO at
the same positions of the sky, allowing
a maximum offset of 1.5![]() .
This way, we found up to 556 different pointings in the ISO Data Archive
containing SWS01 observations corresponding to around 400 different
IRAS sources.
.
This way, we found up to 556 different pointings in the ISO Data Archive
containing SWS01 observations corresponding to around 400 different
IRAS sources.
Unfortunately, many of the sources in this sample had to be discarded because they were known to be slightly extended sources or strongly variable. Extended sources may introduce uncertainty in the results; first, because the SWS calibration is based on point source flux calibration and correction factors are needed to derive their actual absolute flux and, second, because many of these extended sources are usually located in areas of the sky with a complex structure at infrared wavelengths, which complicates even more the problem.
Sources which look extended to SWS are easily recognised because the spectra show strong flux jumps between bands coincident with changes in the aperture size, as we have already shown in Figure 6.1 (bottom panel).
Concerning variability, we know that many of the stars observed by ISO are characterised by their strong photometric variability. Many of them are pulsating stars in the Asymptotic Giant Branch (AGB) phase evolving into planetary nebulae. Some others are young stellar objects which may also be variable (although in this case the amplitude of the variations in this spectral range is usually not very large).
In spite of all these limitations, we ended up with a list of still
more than 250 individual observations
susceptible to be used for cross-calibration with the IRAS photometry
at 12 and 25 ![]() m,
corresponding to more than 100 different astronomical sources, covering
a wide range of spectral shapes and brightness.
m,
corresponding to more than 100 different astronomical sources, covering
a wide range of spectral shapes and brightness.
Each of these 250 individual OLP Version 10 SWS spectra were retrieved
from the ISO Data Archive and further processed with ISAP Version 2.1.
Basically, bad data points affected by glitches were identified and
removed from the spectra using the available tools in ISAP and what
we can call `ISO SWS photometry' was performed at 12 and 25 ![]() m
with the help of the
m
with the help of the syn_phot
application of ISAP, which simply convolves the ISO spectrum with the
transmission profile of the IRAS filters at 12 and 25 ![]() m and
assigns a monochromatic flux at these two wavelengths
under the assumption that the source SED shape is of the
form
m and
assigns a monochromatic flux at these two wavelengths
under the assumption that the source SED shape is of the
form ![]()
![]() f
f![]() = constant, or equivalently
= constant, or equivalently ![]()
![]() f
f![]() = constant, in the same way as IRAS did.
= constant, in the same way as IRAS did.
In Figure 6.14
we show the results obtained at 12 ![]() m. At first sight,
the conclusion is
that, in general, ISO SWS synthetic photometry and IRAS photometry at 12
m. At first sight,
the conclusion is
that, in general, ISO SWS synthetic photometry and IRAS photometry at 12
![]() m are consistent within the 15% level in most cases independent on
the flux level considered (from few Jy to several thousand Jy), with only
a few sources showing a slightly worse agreement (
m are consistent within the 15% level in most cases independent on
the flux level considered (from few Jy to several thousand Jy), with only
a few sources showing a slightly worse agreement (![]() 25-30%)
at low flux levels (below 25 Jy).
25-30%)
at low flux levels (below 25 Jy).
|
Figure 6.16
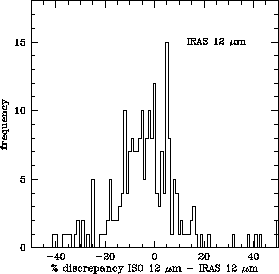
(left panel) shows the distribution of the discrepancies
found between the ISO SWS synthetic photometry and IRAS photometry at
12 ![]() m. Taking the mean absolute flux level of all the measurements
taken with SWS and IRAS at 12
m. Taking the mean absolute flux level of all the measurements
taken with SWS and IRAS at 12 ![]() m the zero-point consistency
is found to be better than 2%.
m the zero-point consistency
is found to be better than 2%.
Note that the overall distribution is, however, slightly asymmetric. In the absence of other known calibration problems, the few obvious outliers towards positive values (ISO fluxes overestimated with respect to IRAS) might correspond to variable sources not recognised as such in the sample (and, thus, not purged) detected close their maximum brightness by ISO, while those towards negative values (ISO fluxes underestimated with respect to IRAS) are interpreted as a combination of previously unknown variable sources (caught this time during minimum brightness by ISO) and slightly bad-pointed observations which have partially escaped from detection.
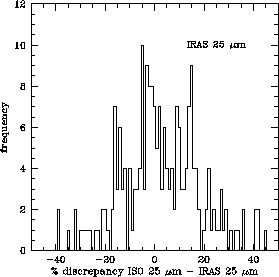
A very similar result is obtained at 25 ![]() m, as we can see
in Figure 6.15.
The level of agreement is again in most cases within 15% for strong
sources (above 50 Jy), with very few exceptions, although it becomes
also slightly worse for low flux levels
(typically within 25-30% for fluxes below 15-20 Jy).
Comparing the absolute flux level of all the measurements
performed with SWS and IRAS at 25
m, as we can see
in Figure 6.15.
The level of agreement is again in most cases within 15% for strong
sources (above 50 Jy), with very few exceptions, although it becomes
also slightly worse for low flux levels
(typically within 25-30% for fluxes below 15-20 Jy).
Comparing the absolute flux level of all the measurements
performed with SWS and IRAS at 25 ![]() m the zero-point consistency
is found to be better than 1% (for the derivation of this number, the
measurements at 25
m the zero-point consistency
is found to be better than 1% (for the derivation of this number, the
measurements at 25 ![]() m corresponding to sources with an
absolute flux level at this wavelength below 15 Jy were excluded).
m corresponding to sources with an
absolute flux level at this wavelength below 15 Jy were excluded).
|
In this case, however, the overall distribution of discrepancies plotted
in Figure 6.16 (right panel)
is not asymmetric, in contrast with what was found at
12 ![]() m. The number of strongly underestimated fluxes by ISO with respect
to IRAS are in this case more or less similar to the number of
overestimations.
The few obvious outliers at both sides of the distribution are actually the
same sources observed as outliers at 12
m. The number of strongly underestimated fluxes by ISO with respect
to IRAS are in this case more or less similar to the number of
overestimations.
The few obvious outliers at both sides of the distribution are actually the
same sources observed as outliers at 12 ![]() m supporting the
hypothesis that they may be variable stars. Thus, we interpret the
symmetry observed in this case as the consequence of the smaller number of
badly pointed observations at this wavelength, probably because of the
larger apertures used by SWS bands 3 and 4, which lowers the probability
of missing part of the incoming flux from a point source when it is observed
slightly off-axis.
m supporting the
hypothesis that they may be variable stars. Thus, we interpret the
symmetry observed in this case as the consequence of the smaller number of
badly pointed observations at this wavelength, probably because of the
larger apertures used by SWS bands 3 and 4, which lowers the probability
of missing part of the incoming flux from a point source when it is observed
slightly off-axis.
|
A similar analysis was performed by Chan et al. 2001, [20]
considering all
sources observed with ISO LWS in the grating scan mode (LWS01 AOT)
for which there was also available photometry at 100 ![]() m in the
IRAS Point Source Catalogue.
m in the
IRAS Point Source Catalogue.
In order to compare the absolute flux calibration of IRAS and ISO LWS
the ISO Data Archive was searched for observations made with ISO at the
same positions of the sky, allowing a maximum offset of
2![]() . The objects were selected according to the additional
following criteria:
. The objects were selected according to the additional
following criteria:
A total number of 170 different pointings were found in the ISO Data Archive containing LWS01 observations satisfying the above criteria corresponding to 120 different IRAS sources. They all were included in this cross-calibration analysis as test cases, covering a wide range of spectral shapes and brightness.
The OLP Version 10 LWS grating spectra were retrieved from the ISO
Data Archive and further processed with ISAP Version 2.1 prior to their
comparison with the IRAS photometry at 100 ![]() m.
Bad data points affected by glitches were removed
from the spectra using the available tools in ISAP. A few
sources had to be corrected also for the so-called `near-infrared leak'.
This is an instrumental effect which produces false strong features at
m.
Bad data points affected by glitches were removed
from the spectra using the available tools in ISAP. A few
sources had to be corrected also for the so-called `near-infrared leak'.
This is an instrumental effect which produces false strong features at
![]() 53
53![]() m and
m and ![]() 105
105 ![]() m on the LWS spectra of sources
with a bright near infrared counterpart. These features can easily be removed
by fitting a power-law to the underlying continuum and assuming they
have a Gaussian profile, which
is a very good aproximation to their real shape
(see ISO Volume III of the Handbook on LWS, [68] for
more details).
m on the LWS spectra of sources
with a bright near infrared counterpart. These features can easily be removed
by fitting a power-law to the underlying continuum and assuming they
have a Gaussian profile, which
is a very good aproximation to their real shape
(see ISO Volume III of the Handbook on LWS, [68] for
more details).
ISAP was also used to perform the equivalent `ISO LWS photometry' at
100 ![]() m of all the 120 sources contained in our new cross-calibration
sample. This was done using again the
m of all the 120 sources contained in our new cross-calibration
sample. This was done using again the syn_phot application,
which convolves the ISO spectrum with
the transmission profile of the IRAS 100 ![]() m filter. This
assigns a monochromatic flux at this wavelength
under the assumption that the source SED shape is of the
form
m filter. This
assigns a monochromatic flux at this wavelength
under the assumption that the source SED shape is of the
form ![]()
![]() f
f![]() = constant, or equivalently
= constant, or equivalently ![]()
![]() f
f![]() = constant, in the same way as IRAS did.
= constant, in the same way as IRAS did.
The main problem which affects our cross-calibration comparison
is the cirrus contamination. The infrared sky is characterised by emission
at 100![]() m from interstellar dust on all spatial scales.
In spite of the restrictions applied to the selected sources,
a significant chance exists that some of them can still be affected
by components of this long-wavelength emission on point source scale.
While the IRAS photometric fluxes quoted in the Point Source Catalogue
are already corrected for this background `cirrus' emission, this is not the
case of the photometry
derived from LWS data, which includes this background contribution.
Therefore, it is necessary to apply a correction either to LWS data or to
the IRAS photometry before making any cross-calibration comparison.
m from interstellar dust on all spatial scales.
In spite of the restrictions applied to the selected sources,
a significant chance exists that some of them can still be affected
by components of this long-wavelength emission on point source scale.
While the IRAS photometric fluxes quoted in the Point Source Catalogue
are already corrected for this background `cirrus' emission, this is not the
case of the photometry
derived from LWS data, which includes this background contribution.
Therefore, it is necessary to apply a correction either to LWS data or to
the IRAS photometry before making any cross-calibration comparison.
Two methods can be applied to perform this `cirrus correction'. Both recovery procedures are only an approximation:
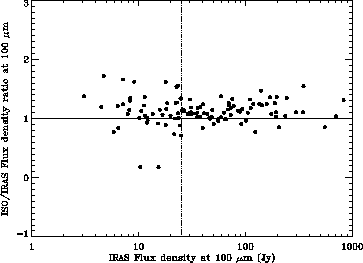
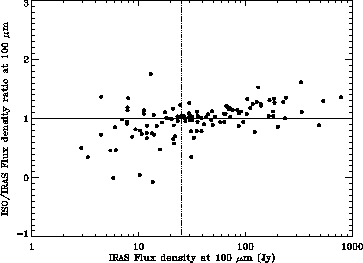
Figure 6.17 shows the distribution of ISO/IRAS flux
density ratios at 100 ![]() m as a function of the
IRAS flux density at 100
m as a function of the
IRAS flux density at 100 ![]() m in a logarithmic scale
using the two different methods above mentioned.
The results obtained suggest that,
in spite of the uncertainties induced by the sometimes large
(and inaccurate) correction factors needed to make this comparison, there is
a reasonable good agreement between ISO and IRAS
at 100
m in a logarithmic scale
using the two different methods above mentioned.
The results obtained suggest that,
in spite of the uncertainties induced by the sometimes large
(and inaccurate) correction factors needed to make this comparison, there is
a reasonable good agreement between ISO and IRAS
at 100 ![]() m in most cases (within 30%).
m in most cases (within 30%).
|
However, ISO flux calibration is found to give systematically 12.5% higher fluxes respect to IRAS (if we take the mean value), independent on the method used. A similar discrepancy (11.3%) was reported in the LWS OLP Version 10 Scientific Validation Report (Lim et al. 2001, [114]), where the calculations were restricted to a short list of low background sources, suggesting that the problem is not related to a wrong background subtraction.
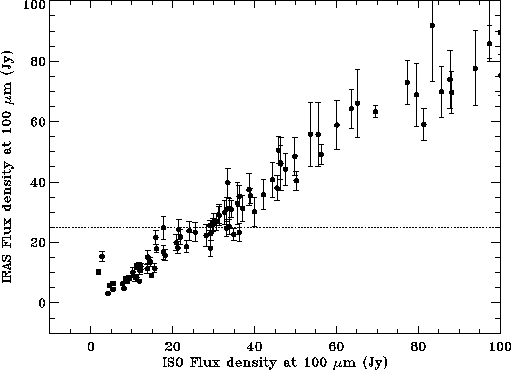
In order to analyse more in detail the problem we have plotted in
Figure 6.18 the results of the same
cross-calibration comparison in a linear scale and only including sources
with IRAS flux densities at 100 ![]() m below 100 Jy using Method 1.
Interestingly, the distribution shows the existence of at least 2 different
turning points leading to three different regimes. The first regime is
followed by sources with ISO fluxes below 25 Jy. These are the sources
showing the higher degree of consistency with ISO in terms of absolute flux
level, although the dispersion is very high at these low flux levels,
as expected, due to inaccurate dark current subtraction. A second
regime is followed by sources well detected by ISO with
fluxes at 100
m below 100 Jy using Method 1.
Interestingly, the distribution shows the existence of at least 2 different
turning points leading to three different regimes. The first regime is
followed by sources with ISO fluxes below 25 Jy. These are the sources
showing the higher degree of consistency with ISO in terms of absolute flux
level, although the dispersion is very high at these low flux levels,
as expected, due to inaccurate dark current subtraction. A second
regime is followed by sources well detected by ISO with
fluxes at 100 ![]() m between 25 and 75 Jy. These sources show
systematically 10-15% higher ISO fluxes compared
to IRAS with a dispersion of only 20%. And there seems to be even a third
regime beyond 75 Jy which shows an even larger systematic discrepancy (up to
20%) with a similar dispersion. The same behaviour, although not shown here,
is observed when we use Method 2.
m between 25 and 75 Jy. These sources show
systematically 10-15% higher ISO fluxes compared
to IRAS with a dispersion of only 20%. And there seems to be even a third
regime beyond 75 Jy which shows an even larger systematic discrepancy (up to
20%) with a similar dispersion. The same behaviour, although not shown here,
is observed when we use Method 2.
|
The discontinuities observed are still of unknown origin and may be either in ISO or in IRAS calibration. It is remarkable that the problem seems to be not related with inaccuracy at low flux levels induced by an inaccurate dark current subtraction since this would just increase the observed dispersion but it would not change the zero-point of the absolute flux calibration. Actually, the strongest discrepancies are observed in the group of the brightest sources.
Neither does the problem seem to be directly correlated with the inaccuracy of the diferent methods used for cirrus correction, since it equally affects sources with low and high background, as we have already mentioned.
An interesting independent comparison between ISO LWS and IRAS photometry at
60 and 100 ![]() m was carried out by Brauher & Lord 2001,
[12] on a large sample of extragalactic sources.
m was carried out by Brauher & Lord 2001,
[12] on a large sample of extragalactic sources.
This sample consisted of observations of galaxies taken with the LWS in the
grating modes (LWS01 and LWS02) that were reduced in a uniform manner using
all of the advanced data reduction techniques of LIA and ISAP starting from
OLP Version 7 data products. The galaxy
sample comprised nearly all galaxies observed during the ISO
mission whose far-infrared emission fell within the
75![]()
![]() LWS beam
and had IRAS Point Source Catalogue detections.
There were 155 such galaxies in the ISO Data Archive
with 60
LWS beam
and had IRAS Point Source Catalogue detections.
There were 155 such galaxies in the ISO Data Archive
with 60 ![]() m fluxes ranging from below 1 Jy to 300 Jy.
m fluxes ranging from below 1 Jy to 300 Jy.
In this study, a small correction factor was introduced in the derivation
of the ISO synthetic photometry at 60 ![]() m with ISAP
in order to account for the
fraction of the IRAS 60
m with ISAP
in order to account for the
fraction of the IRAS 60 ![]() m filter not covered by ISO LWS (27-87
m filter not covered by ISO LWS (27-87 ![]() m
is the spectral coverage of the IRAS 60
m
is the spectral coverage of the IRAS 60 ![]() m filter
versus 43-197
m filter
versus 43-197 ![]() m for LWS). This may introduce some uncertainty in the
derived values.
Assuming that the majority of the galaxies used for this comparison
span a narrow temperature range (30-45 K)
the amount of the integrated flux measurement missed by
LWS is estimated to vary from 2-8%. Thus,
an average correction of 5% to the LWS 60
m for LWS). This may introduce some uncertainty in the
derived values.
Assuming that the majority of the galaxies used for this comparison
span a narrow temperature range (30-45 K)
the amount of the integrated flux measurement missed by
LWS is estimated to vary from 2-8%. Thus,
an average correction of 5% to the LWS 60 ![]() m fluxes was applied to all
the galaxies in the sample.
m fluxes was applied to all
the galaxies in the sample.
The LWS02 60 ![]() m and
100
m and
100 ![]() m continuum fluxes must also have a secondary correction
applied. The fluxes for this AOT were estimated by fitting a 2-5
m continuum fluxes must also have a secondary correction
applied. The fluxes for this AOT were estimated by fitting a 2-5 ![]() m
linear baseline through the IRAS filter central wavelengths, essentially
producing a monochromatic flux density. This flux density must be corrected
to estimate the flux density IRAS found over its extended passband.
Fitting a linear baseline to the spectra overestimates the integrated
spectral photometry by 12% at 60
m
linear baseline through the IRAS filter central wavelengths, essentially
producing a monochromatic flux density. This flux density must be corrected
to estimate the flux density IRAS found over its extended passband.
Fitting a linear baseline to the spectra overestimates the integrated
spectral photometry by 12% at 60 ![]() m and 9% at 100
m and 9% at 100 ![]() m. Thus, the
LWS02 fluxes were also corrected for these overestimations accordingly.
m. Thus, the
LWS02 fluxes were also corrected for these overestimations accordingly.
After these corrections were applied, the infrared sky
background was estimated using IRSKY (images from the all-sky IRAS Survey
Atlas with a resolution of 4![]() in each of the IRAS bands) and then
removed from the LWS data, in a similar way as Method 2 described above
does it. The background subtracted LWS data were
then compared with the IRAS photometry at 60 and 100
in each of the IRAS bands) and then
removed from the LWS data, in a similar way as Method 2 described above
does it. The background subtracted LWS data were
then compared with the IRAS photometry at 60 and 100 ![]() m quoted in the
Point Source Catalogue.
m quoted in the
Point Source Catalogue.
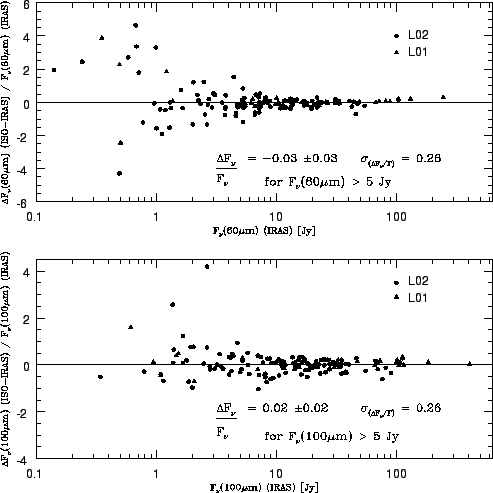
Figure 6.19 shows how the LWS and IRAS data compare after a careful reduction with the LWS Interactive Analysis software (LIA), including interactive dark currrent subtraction, absolute responsivity corrections, as well as manual removal of glitches and fringes.
|
|
The results obtained suggests an overall good
agreement between ISO LWS and IRAS both at 60 and 100 ![]() m, typically
within 26% for fluxes above 5 Jy.
The ISO fluxes, according to this study are (1) systematically lower than
IRAS fluxes by 3% between 5-300 Jy at 60
m, typically
within 26% for fluxes above 5 Jy.
The ISO fluxes, according to this study are (1) systematically lower than
IRAS fluxes by 3% between 5-300 Jy at 60 ![]() m
and (2) systematically higher
than the IRAS fluxes by 2% between 5-300 Jy at 100
m
and (2) systematically higher
than the IRAS fluxes by 2% between 5-300 Jy at 100 ![]() m.
Below 5 Jy the dispersion increases by a
factor of two and is attributed to the dark current subtraction errors.
m.
Below 5 Jy the dispersion increases by a
factor of two and is attributed to the dark current subtraction errors.
However, it is worth to note that if only the brightest sources in the
sample are considered (above 25 Jy) the LWS fluxes are found
systematically 12% higher than the corresponding IRAS fluxes both
at 60 ![]() m and 100
m and 100 ![]() m. This result
is strikingly similar to the offset found at 100
m. This result
is strikingly similar to the offset found at 100 ![]() m by Chan et al.
2001, [20].
m by Chan et al.
2001, [20].
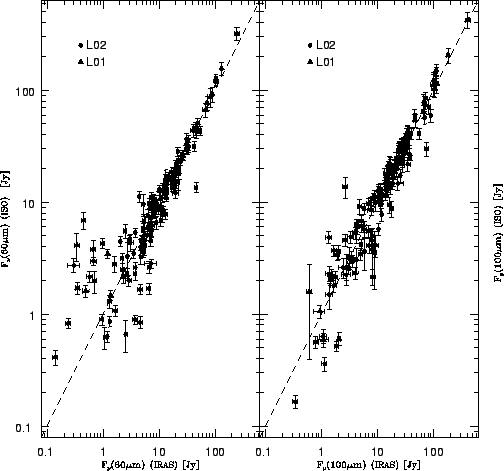
The strong discrepancies at high flux levels are more evident in Figure 6.20 where we have plotted the same results in a different format. The discrepancy seems to be of the order of 20-40% for fluxes above 70-80 Jy, supporting our previous findings.
We can take advantage of the availability of the sample of cross-calibration
sources used for the internal comparison between SWS and LWS presented in
Section 6.2.1.4 to produce good quality, composite ISO SWS+LWS
spectra which can be directly compared with IRAS photometry at 60 and 100
![]() m. The spectral coverage of the resulting
ISO composite spectrum is such that there is no need need to apply in this
case any correction factor to the IRAS photometry at 60
m. The spectral coverage of the resulting
ISO composite spectrum is such that there is no need need to apply in this
case any correction factor to the IRAS photometry at 60 ![]() m, since the
IRAS photometric band is fully covered by ISO when we combine SWS+LWS data
in a single spectrum.
m, since the
IRAS photometric band is fully covered by ISO when we combine SWS+LWS data
in a single spectrum.
The test sample includes 23 sources which are listed in Table 6.4. Note that, unfortunately, we had to exclude from this cross-calibration analysis some of the sources used in the previous comparison. For instance, this time we could not include the well
known variable sources TX Cam or OH 26.5+0.6, observed close in time by
ISO with SWS and LWS, but at a completely different epoch with respect to
IRAS photometry, taken in 1983-1984. Neither we could use the source IRAS 15452![]() 5459 because of the bad quality of its IRAS photometry at 60 and 100
5459 because of the bad quality of its IRAS photometry at 60 and 100 ![]() m.
m.
| IRAS | IRAS | IRAS | ISO | ISO | IRAS | ||
| Source | 60 |
100 |
100 |
60 |
100 |
CIRR2 | Notes |
| HD 161796 | 151.7 | 48.7 | 49.2 | 167.3 | 56.3 | 1 | |
| NGC 6543 | 133.3 | 62.7 | 63.3 | 144.2 | 72.9 | 1 | |
| IRAS 19114+0002 | 515.9 | 168.1 | 169.8 | 674.5 | 224.3 | 1 | |
| R Dor | 243.5 | 83.5 | 84.3 | 311.1 | 96.3 | 1 | strong near infrared leak |
| CRL 618 | 1036 | 339.9 | 343.3 | 1361 | 547.4 | 1 | bad SWS band 4 |
|
CPD |
199.1 | 91.7 | 93.5 | 236.5 | 105.0 | 2 | |
| CW Leo | 5652 | 922.0 | 940.0 | 5297 | 1247 | 2 | |
| Circinus | 248.7 | 315.9 | 322.2 | 314.6 | 426.3 | 2 | bad SWS band 4 |
| HD 101584 | 193.0 | 104.0 | 110.2 | 226.4 | 132.5 | 3 | |
|
Hen 2 |
176.6 | 71.3 | 75.6 | 217.5 | 94.7 | 3 | |
|
M 1 |
589.6 | 408.2 | 432.7 | 792.6 | 592.6 | 3 | |
| HD 44179 | 173.1 | 66.2 | 70.2 | 215.1 | 81.9 | 3 | |
| IC 418 | 103.6 | 31.2 | 33.1 | 119.6 | 35.4 | 3 | |
|
IRAS 16342 |
290.2 | 139.4 | 157.5 | 262.8 | 122.1 | 4 | mean of two measurements |
| SAO 34504 | 96.6 | 41.0 | 46.3 | 119.1 | 44.0 | 4 | bad SWS band 4 |
| AFGL 4106 | 851.8 | 181.1 | 239.1 | 1053 | 310.4 | 5 | |
|
|
127.0 | 49.9 | 65.9 | 140.1 | 52.8 | 5 | strong near infrared leak |
|
IRAS 16594 |
131.4 | 34.4 | 61.2 | 146.2 | 78.2 | 6 | |
| IRAS 21282+5050 | 33.4 | 15.0 | 26.7 | 38.6 | 31.4 | 6 | |
| IRAS 21318+5631 | 90.0 | 25.4 | 44.7 | 93.8 | 45.0 | 6 | |
|
|
115.5 | 31.9 | 56.1 | 139.2 | 53.2 | 6 | bad SWS band 4 |
| & strong near infrared leak | |||||||
| VX Sgr | 262.7 | 82.3 | 144.9 | 312.9 | 197.9 | 7 | |
At these long wavelengths, and as it was already mentioned in
Section 6.3.1.2,
one needs to consider very seriously the amount of
cirrus contamination in the measurements.
In principle, the effect is expected to be strong only at 100 ![]() m
in regions of strong cirrus background while the measurements at 60
m
in regions of strong cirrus background while the measurements at 60 ![]() m
will only be slightly affected.
In any case, in order to take this possibility into account and because it
can be of help in
the analysis, the sources in Table 6.4 have been
sorted as a function
of the parameter CIRR2, previously defined in Equation
6.1, which is directly
related with the background emission at 100
m
will only be slightly affected.
In any case, in order to take this possibility into account and because it
can be of help in
the analysis, the sources in Table 6.4 have been
sorted as a function
of the parameter CIRR2, previously defined in Equation
6.1, which is directly
related with the background emission at 100 ![]() m in the vicinities of the
IRAS point source.
m in the vicinities of the
IRAS point source.
For the derivation of the ISO SWS+LWS synthetic photometry at 60 and
100 ![]() m listed in Table 6.4
we used again ISAP Version 2.1. First the corresponding SWS+LWS
OLP Version 10.1 spectra were directly retrieved from the ISO Data Archive
and combined to create the composite spectra.
Then bad data points affected by glitches in both SWS and LWS
sections of the composite spectra were removed and the LWS spectra were
corrected for near
infrared leaks when necessary. Finally the
m listed in Table 6.4
we used again ISAP Version 2.1. First the corresponding SWS+LWS
OLP Version 10.1 spectra were directly retrieved from the ISO Data Archive
and combined to create the composite spectra.
Then bad data points affected by glitches in both SWS and LWS
sections of the composite spectra were removed and the LWS spectra were
corrected for near
infrared leaks when necessary. Finally the syn_phot
application of ISAP was used to convolve the ISO spectrum with the
transmission profile of the IRAS filters at 60 and 100 ![]() m. This way
we derived a monochromatic flux at each of these wavelengths
under the assumption that the source SED shape is of the
form
m. This way
we derived a monochromatic flux at each of these wavelengths
under the assumption that the source SED shape is of the
form ![]()
![]() f
f![]() = constant, or equivalently
= constant, or equivalently ![]()
![]() f
f![]() = constant, in the same way as IRAS did.
= constant, in the same way as IRAS did.
Figure 6.21 shows the distribution of the
derived ISO/IRAS flux density ratios at 60 ![]() m as a function of the
IRAS flux density at 60
m as a function of the
IRAS flux density at 60 ![]() m in logarithmic scale.
As we can see the systematic discrepancy between ISO and
IRAS photometry at 60
m in logarithmic scale.
As we can see the systematic discrepancy between ISO and
IRAS photometry at 60 ![]() m (of the order of 15%) is confirmed.
m (of the order of 15%) is confirmed.
The discrepancy cannot be attributed to background contamination since it is not correlated at all with the value of the IRAS CIRR2 parameter. Instead, there seems to be a clear correlation with increasing flux, similar to that previously found for the sample of extragalactic sources analysed in Section 6.3.1.2.
In order to determine whether this systematic discrepancy between ISO and LWS
is also found at 100 ![]() m we used again the sources in Table
6.4 to perform an independent analysis.
m we used again the sources in Table
6.4 to perform an independent analysis.
Following the strategy proposed by Josephine Chan in their comparison of
ISO data with IRAS photometry at 100 ![]() m, we used their Method 1,
this is, the restoration of the background emission estimated from the
CIRR2 parameter to the quoted IRAS flux density at 100
m, we used their Method 1,
this is, the restoration of the background emission estimated from the
CIRR2 parameter to the quoted IRAS flux density at 100 ![]() m in the
IRAS Point Source Catalogue Version
2.1, to determine the total cirrus+source flux density. This is the
quantity that must be used to compare with the LWS measurements,
as LWS measured both source+background emission.
m in the
IRAS Point Source Catalogue Version
2.1, to determine the total cirrus+source flux density. This is the
quantity that must be used to compare with the LWS measurements,
as LWS measured both source+background emission.
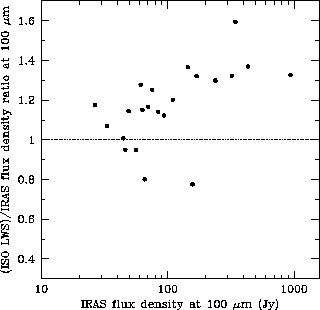
Figure 6.22 shows in logarithmic scale
the distribution of ISO/IRAS flux
density ratios at 100 ![]() m as a function of the restored
IRAS flux density at 100
m as a function of the restored
IRAS flux density at 100 ![]() m.
m.
|
Interestingly, we see again the same effect. ISO equivalent fluxes at
100 ![]() m are found to be around 20% higher if we take the
mean value of all measurements and up to 60% in the most extreme cases.
The discrepancies found are not correlated with IRAS CIRR2, being
equally distributed among sources with low and high background contamination.
Surprisingly we find again, instead, what seems to be a clear correlation
with the flux level, so that in general the brightest sources are those
showing the strongest discrepancies while
ISO data and IRAS photometry appear consistent to within the 25% level
for sources below 100 Jy.
m are found to be around 20% higher if we take the
mean value of all measurements and up to 60% in the most extreme cases.
The discrepancies found are not correlated with IRAS CIRR2, being
equally distributed among sources with low and high background contamination.
Surprisingly we find again, instead, what seems to be a clear correlation
with the flux level, so that in general the brightest sources are those
showing the strongest discrepancies while
ISO data and IRAS photometry appear consistent to within the 25% level
for sources below 100 Jy.
A plot which combines all the results obtained in the three independent
cross-calibration analysis performed at 60 and 100 ![]() m
between ISO and IRAS here presented is shown in Figure 5.8 of the ISO
Handbook Volume III on LWS.
m
between ISO and IRAS here presented is shown in Figure 5.8 of the ISO
Handbook Volume III on LWS.
In summary, our conclusion is that both at 60 and 100 ![]() m IRAS and
ISO agree within a few % in average for sources fainter than 25 Jy,
while ISO
fluxes are found systematically higher than IRAS fluxes for sources brighter
than 25 Jy. The difference increases from about 15% around 100 Jy, to a level
of about 20% for sources up to 400 Jy, and up to
30-50% for sources brighter than 400 Jy.
m IRAS and
ISO agree within a few % in average for sources fainter than 25 Jy,
while ISO
fluxes are found systematically higher than IRAS fluxes for sources brighter
than 25 Jy. The difference increases from about 15% around 100 Jy, to a level
of about 20% for sources up to 400 Jy, and up to
30-50% for sources brighter than 400 Jy.
The reason for this behaviour is not understood. We know it is not due to inaccurate dark current subtraction, nor to cirrus background contamination. A possible cause could be some non-linearities in the infrared detectors. However, the problem could be associated with IRAS data and not with ISO.
Indeed, Figure IV.A.4.2 of the IRAS Explanatory Supplement,
[84] does evidence detector non-linearity behaviour and
Section VI.B.4.d quotes errors of respectively 30% and 70% at 60 and
100 ![]() m for sources above 100 Jy.
m for sources above 100 Jy.
LWS observations have also been made at a number of positions in the
complex Trumpler 14 and 16 fields, and in the direction of the Galactic
Centre. LWS data have been compared with the IRAS
100 ![]() m fluxes at the same positions. All fields contain large areas of
extended emission, which although relatively smooth, do change by a
factor of
m fluxes at the same positions. All fields contain large areas of
extended emission, which although relatively smooth, do change by a
factor of ![]() 40 within each region.
40 within each region.
The point source fluxes (Jy) provided by the LWS pipeline calibration
have been converted to extended source fluxes (MJy sr![]() ) using the
correction factors implemented in ISAP Version 2.0.
) using the
correction factors implemented in ISAP Version 2.0.
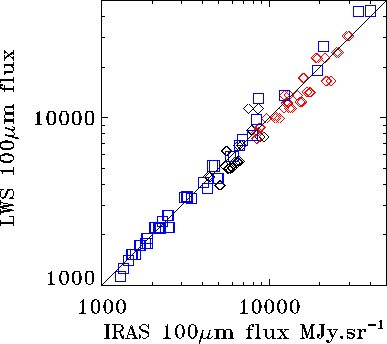
Figure 6.23 shows the comparison of the
converted LWS and IRAS 100 ![]() m fluxes. As we can see, the results
indicate that there is an excellent agreement between the fluxes provided
by ISO and the IRAS results. From the analysis of the data we obtain
a mean ratio, LWS/IRAS = 1.0
m fluxes. As we can see, the results
indicate that there is an excellent agreement between the fluxes provided
by ISO and the IRAS results. From the analysis of the data we obtain
a mean ratio, LWS/IRAS = 1.0![]() 0.1.
0.1.
|
Part of the uncertainty is probably due to the unresolved structure of the sources observed within the beam. This is because the extended source correction factors applied have been derived under the assumption of a smooth and very extended flux distribution. In the real world, structure or embedded sources could produce significant discrepancies from the ideal situation and, with it, differences in flux.
Note also that for fields containing multiple sources the observed flux will depend critically on the precise positions of the sources relative to the optical axis. To recover or model the observed flux requires positional information on the sources and a deconvolution with the PSF and instrumental profile. Indeed, for single point sources observed off-axis a similar procedure is required to recover the correct flux.
The database of ISO observations generated by a project intended to search for Vega-like debris disks around nearby main-sequence stars (Habing et al. 1996, [69]; Laureijs et al. 2002, [106]) has also been used to assess the quality of ISOPHOT photometric calibration.
The sample contains more than 80 main sequence stars that were observed
with ISOPHOT at 25, 60, 150 and 170 ![]() m, in order to determine
whether the star had an infrared excess indicating the presence of a
dusty disk. Unfortunately, the number of stars found with disks was very
low: only 8 out of 65 stars observed with ISO
showed a significant excess at 60
m, in order to determine
whether the star had an infrared excess indicating the presence of a
dusty disk. Unfortunately, the number of stars found with disks was very
low: only 8 out of 65 stars observed with ISO
showed a significant excess at 60 ![]() m.
m.
The positive point, from the cross-calibration perspective,
is that the non-detected stars constitute a nice
homogeneous sample of observations which can be used to improve our
knowledge of the quality of the observations made with ISOPHOT
by comparing the observations with models and with
the IRAS photometry of the same sources at 25 and at 60 ![]() m.
m.
The subsample of observations here analysed
were performed using the AOT PHT03 (PHT-P detectors) in triangular chopped
mode at 25 ![]() m and mini-maps (3
m and mini-maps (3![]() 3 with 46
3 with 46![]()
![]() steps) centred at the source location at 60
steps) centred at the source location at 60 ![]() m using the AOT PHT22, and
reflects the status of the PHT calibration as of OLP Version 8.
m using the AOT PHT22, and
reflects the status of the PHT calibration as of OLP Version 8.
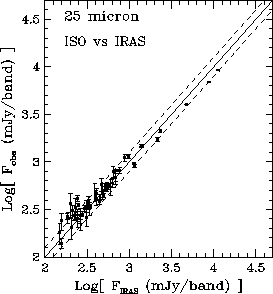
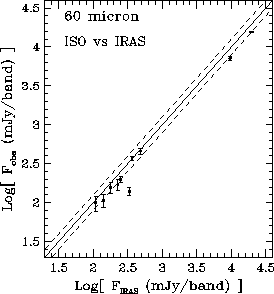
Figure 6.24
shows the result of the ISO observations compared to the
IRAS photometry (when available) of the stars observed at 25 and 60 ![]() m.
m.
|
As we can see, the level of agreement with IRAS photometry at 25 ![]() m
is in most cases better than 25%. The brighter targets (F
m
is in most cases better than 25%. The brighter targets (F![]()
![]() 1 Jy)
appear to have systematically ISO flux densities lower than the IRAS values.
This underestimation
is expected from the usage of the chopped mode, where a relatively high
source-background contrast causes a signal loss due to transient
responsivity in the PHT-P detector. On the other hand, the ISO fluxes of the
fainter stars (F
1 Jy)
appear to have systematically ISO flux densities lower than the IRAS values.
This underestimation
is expected from the usage of the chopped mode, where a relatively high
source-background contrast causes a signal loss due to transient
responsivity in the PHT-P detector. On the other hand, the ISO fluxes of the
fainter stars (F![]()
![]() 300 mJy) appear overestimated with respect to
IRAS. The explanation for this overestimation is still not clear
but it might be the result of
(i) the peculiar transient behaviour of the P2 detector, (2) a low level
signal non-linearity, or (3) uncertainties in the IRAS calibration (we have
to consider that at these low flux levels we are close to the detection
limit of IRAS at 25
300 mJy) appear overestimated with respect to
IRAS. The explanation for this overestimation is still not clear
but it might be the result of
(i) the peculiar transient behaviour of the P2 detector, (2) a low level
signal non-linearity, or (3) uncertainties in the IRAS calibration (we have
to consider that at these low flux levels we are close to the detection
limit of IRAS at 25 ![]() m).
m).
At 60 ![]() m the statistics become poorer. IRAS fluxes are available only
for 11 targets. The obvious outlier showing F
m the statistics become poorer. IRAS fluxes are available only
for 11 targets. The obvious outlier showing F![]()
![]() F
F![]() consists of 3 resolved point sources in the ISOPHOT map. For the
remaining detections the correlation is high. However, the ISO observations
are systematically (
consists of 3 resolved point sources in the ISOPHOT map. For the
remaining detections the correlation is high. However, the ISO observations
are systematically (![]() 25%) below the IRAS values.
This discrepancy could partially be attributed to the fact that we have
assumed point source calibration in the conversion from measured flux in an
array pixel to the final target flux. In case of small extended sources
the flux would be underestimated for this reason and this is actually what we
observe in stars like Vega and
25%) below the IRAS values.
This discrepancy could partially be attributed to the fact that we have
assumed point source calibration in the conversion from measured flux in an
array pixel to the final target flux. In case of small extended sources
the flux would be underestimated for this reason and this is actually what we
observe in stars like Vega and ![]() -Pictoris, contained in
the sample, which are known to be slightly extended infrared sources.
-Pictoris, contained in
the sample, which are known to be slightly extended infrared sources.
As a consequence of the calibration upgrades implemented in the latest versions of the ISOPHOT pipeline, the accuracy of chopped PHT-P and PHT-C photometry has further improved significantly.
As an example, we show in Tables 6.5 and 6.6 the photometric data derived from OLP Version 10 for a subset of the stars in the sample above mentioned compared with IRAS photometry and model predictions (Ulrich Klaas, private communication). ISOPHOT and IRAS fluxes are colour corrected.
| Source | ISOPHOT flux | IRAS flux | Model flux |
|
|
|
|
|
| Sirius | 18.52 | 24.09 | 21.54 |
| HR7557 | 5.24 | 5.76 | 5.27 |
| HR7310 | 4.31 | 3.66 | 3.40 |
| HR5986 | 0.68 | 0.53 | 0.52 |
| 0.63 | |||
| 0.58 | |||
| HR5914 | 0.39 | 0.41 | 0.38 |
| HR5447 | 0.32 | 0.30 | 0.26 |
| HR7469 | 0.25 | 0.22 | 0.25 |
| Source | ISOPHOT flux | IRAS flux | Model flux |
|
|
|
|
|
| Sirius | 4.08 | 3.73 | 3.68 |
| 4.04 | |||
| HR1654 | 1.68 | 1.53 | 1.61 |
| HR7980 | 1.25 | 1.12 | 1.17 |
| HR7557 | 0.95 | 0.95 | 0.90 |
| HD185144 | 0.11 | 0.12 | 0.10 |
| HR7469 | 0.06 | <0.75 | 0.04 |
In order to extend the cross-calibration analysis of ISO SWS to observations made with other space facilities than IRAS we performed a similar analysis using this time photometric data provided by the Midcourse Space Experiment (MSX; Egan et al. 1999, [48]).
Briefly, MSX was a multi-discipline experiment sponsored by the USA Ballistic Missile Defense Organization. The principal objective of the MSX astronomy experiments was to complete the census of the mid-infrared sky. Experiments were designed to cover the regions either missed by IRAS and COBE/DIRBE or where the sensitivity of IRAS was degraded by confusion noise in regions of high source densities or structured extended emission, including the entire Galactic Plane.
The MSX Point Source Catalogue contains all the point sources detected
with signal-to-noise ratio ![]() 3 following criteria very similar to IRAS
(detection requires multiple confirmations).
3 following criteria very similar to IRAS
(detection requires multiple confirmations).
The infrared instrument on MSX was a 35 cm clear aperture off-axis telescope
cooled by a single solid H![]() cryostat equipped with Si:As BiB arrays with
eight columns of detectors, each with 192 rows of 18''.3 square pixels, and
a high sensitivity (0.1 Jy at 8.3
cryostat equipped with Si:As BiB arrays with
eight columns of detectors, each with 192 rows of 18''.3 square pixels, and
a high sensitivity (0.1 Jy at 8.3 ![]() m). Two narrow band
filters covered the spectral regions centred at 4.29 (B1) and 4.35 (B2)
m). Two narrow band
filters covered the spectral regions centred at 4.29 (B1) and 4.35 (B2)
![]() m, and four broad-band filters covered the spectral regions centred
at 8.28 (A), 12.13 (C), 14.65 (D) and 21.34 (E)
m, and four broad-band filters covered the spectral regions centred
at 8.28 (A), 12.13 (C), 14.65 (D) and 21.34 (E) ![]() m (see Table 6.7).
m (see Table 6.7).
| Band | No | Isophotal | 50% | Isophotal | Zero | Abs. | Survey | Effective FOV |
| active | |
peak | BW[ |
mag. | photom. | sens. |
|
|
| cols. | intensity | flux [Jy] | accuracy | [Jy] | [ |
|||
| A | 8 | 8.28 | 6.8 |
3.36 | 58.49 | 5% | 0.1 |
10.6 |
|
B |
2 | 4.29 | 4.22 |
0.104 | 194.6 | 9% | 10 |
14.0 |
|
B |
2 | 4.35 | 4.24 |
0.179 | 188.8 | 9% | 6 |
14.0 |
| C | 4 | 12.13 | 11.1 |
1.72 | 26.51 | 3% | 1.1 |
11.7 |
| D | 4 | 14.65 | 13.5 |
2.23 | 18.29 | 4% | 0.9 |
11.3 |
| E | 2 | 21.34 | 18.2 |
6.24 | 8.80 | 6% | 2 |
12.6 |
In the following analysis we will only consider the broad MSX filters A, C, D and E, which are the most sensitive filters onboard MSX.
About 100 sources with an available SWS01 spectrum in the ISO Data Archive were identified to have their corresponding mid-infrared counterpart in the MSX Point Source Catalogue.
After excluding from this sample all the suspected variable stars and extended sources (as we did for the cross-calibration with IRAS) we ended up with around 50 sources suitable for cross-calibration with MSX at all the above mentioned filters.
The OLP Version 10 SWS spectra of these sources were retrieved
from the ISO Data Archive and further processed with ISAP Version 2.1.
Bad data points affected by glitches were identified and
removed from the SWS spectra using the available tools in ISAP and
ISO `synthetic photometry' was performed at the A, C, D and E MSX filters
with the help of syn_phot. This ISAP application convolves the ISO
spectrum with the transmission profile of the corresponding MSX filters
assigning a monochromatic flux to each band
under the assumption that the SED shape is of the
form ![]()
![]() f
f![]() = constant, or equivalently
= constant, or equivalently ![]()
![]() f
f![]() = constant.
= constant.
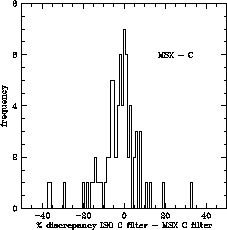
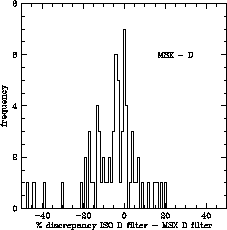
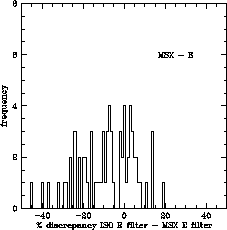
In Figures 6.25 to 6.28 we show the results obtained. As we can see, they are very similar to the ones obtained in the previous cross-calibration comparison with IRAS data.
|
Esentially, the absolute flux calibration of ISO SWS and MSX agrees to within the 10-15% level at all flux levels, with very little degradation even at the lower flux levels.
The few outliers are interpreted as previously unknown variable sources and/or slightly badly pointed observations, similarly to what was observed in the previous comparison with IRAS.
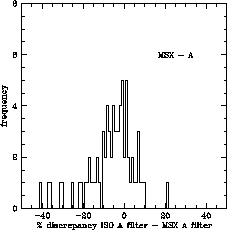
Comparing the absolute flux level of all the measurements peformed with ISO and MSX there is a general good agreement in all filters with a zero-point consistency better than 5% in all cases with the exception of filter A (see Figure 6.29), where the distribution of observed discrepancies show a marked asymmetry.
|
This asymmetry is most probably due to a higher percentage of
badly pointed observations (similarly
to what we observed also in the cross-calibration comparison with IRAS
at 12 ![]() m). Note that this is the filter covering a wavelength
range where SWS is most sensitive to small
pointing offsets because of the smaller aperture size.
m). Note that this is the filter covering a wavelength
range where SWS is most sensitive to small
pointing offsets because of the smaller aperture size.
On the other hand, the slightly worse correlation found between ISO SWS and MSX filters D and E (compared to filters A and C) is probably induced by the fact that these filters show a larger overlap with SWS band 3, which is known to be less accurate than SWS band 2 in terms of absolute flux calibration.
|
|
Globally considered, the main difference found with respect to the previous cross-calibration comparison with IRAS is the absence of the strong discrepancies observed at high flux levels between ISO and IRAS data. This supports our hypothesis that the non-linearity problem is in the IRAS calibration at high flux levels.
|
ISOPHOT data has also been compared with COBE/DIRBE data as part of our cross-calibration analysis. The Diffuse Infrared Background Experiment (DIRBE; Hauser et al. 1998b, [76]) was one of the three instruments onboard COBE (the Cosmic Background Explorer), a satellite developed by NASA's Goddard Space Flight Center and launched in November 1989 to measure the diffuse infrared and microwave radiation from the early universe to the limits set by our astrophysical environment.
DIRBE obtained infrared absolute sky brightness maps in the wavelength
range 1.25 to 240 ![]() m. Most of this range was also covered by ISOPHOT.
However, the comparison between ISOPHOT and COBE/DIRBE data
is complicated, mainly because of the vastly different beam sizes
(42
m. Most of this range was also covered by ISOPHOT.
However, the comparison between ISOPHOT and COBE/DIRBE data
is complicated, mainly because of the vastly different beam sizes
(42![]() FWHM for COBE/DIRBE), as we will see below.
FWHM for COBE/DIRBE), as we will see below.
In order to check the consistency between the absolute flux calibration of COBE/DIRBE photometry and PHT-S spectroscopy we present here a comparison of the absolute surface brightness of the zodiacal light measured by PHT-S and COBE/DIRBE data reported by Dotto et al. 2002, [46].
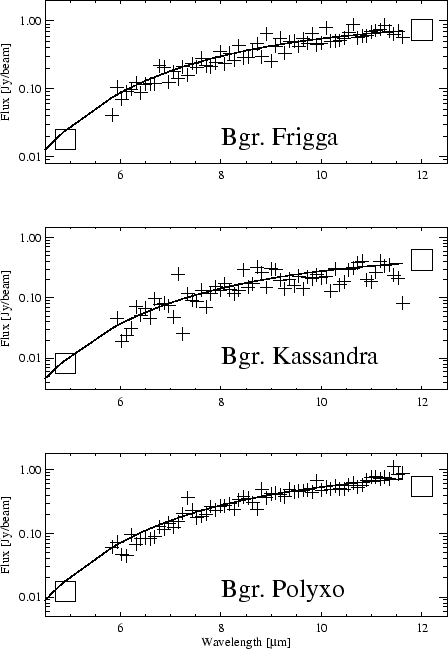
Figure 6.30 shows the OLP Version 9.0 sky background
measurements taken with the long wavelength
channel of PHT-S in the vicinities of the asteroids Frigga, Kassandra and
Polyxo together with COBE data at 4.9 and 12 ![]() m. Note that the zodiacal
light is the dominating background at the PHT-S wavelengths.
m. Note that the zodiacal
light is the dominating background at the PHT-S wavelengths.
|
As we can see PHT-S is in excellent agreement with COBE data. From the sky background observed we can deduce that the zodiacal light can be well approximated by a blackbody emitting at a temperature of 267 K.
For the short wavelength channel the comparison is not possible because
the extremely low flux in this range is below the detection limit of PHT-S.
In spite of this we see that the featureless PHT-S spectrum
fits nicely between the COBE/DIRBE photometric data points at 4.9 and
12 ![]() m.
m.
Unfortunately, COBE did not cover wavelengths in
between 5 and 12 ![]() m, in the range where the
brightness of the zodiacal light rises very steeply. However, complementary
results obtained with PHT-P and ISOCAM confirm that the
zodiacal emission spectrum can be well fitted by a
blackbody of 267 K and that
the spectrum is featureless between 5 and 16
m, in the range where the
brightness of the zodiacal light rises very steeply. However, complementary
results obtained with PHT-P and ISOCAM confirm that the
zodiacal emission spectrum can be well fitted by a
blackbody of 267 K and that
the spectrum is featureless between 5 and 16 ![]() m.
m.
The consistency of the absolute sky brightness derived from ISO C100 maps with COBE/DIRBE data was also verified as part of the OLP Version 8.4 scientific validation of PHT22 staring raster maps (Klaas et al. 2000, [100]).
The mean surface brightness of specific areas of the sky was derived from the full C100 maps used for the flat-field assessment and compared with the surface brightness values in the corresponding filters or adjacent filters of COBE/DIRBE. The use of the full area of the ISOPHOT maps offers the advantage of getting a solid angle coverage comparable to the COBE/DIRBE pixels. However, in most cases the solid angles of the ISOPHOT maps are still considerably smaller than one pixel in COBE/DIRBE. The COBE/DIRBE annual maps were used (since at the wavelengths considered the contribution from the zodiacal light is very small) to determine the fluxes for the DIRBE pixel coincident with the map area centroid. For a check of the large scale variations of the sky background average fluxes of a 1.5 degree circular area were as well determined. ISOPHOT maps containing bright sources were not considered (they would give a considerably higher average surface brightness due to the smaller area considered).
In Table 6.8
we present the results obtained. Except for the different beam
sizes a comparison of the ISOPHOT/DIRBE 60 and 100 ![]() m filters is
relatively straightforward. In general a good agreement better than 25%,
in particular for those maps with comparable sizes to the COBE/DIRBE beam, is
found. All larger deviations can be explained by the source structure which
is extended over the ISOPHOT map area, but compact inside the COBE/DIRBE beam.
The largest outlier shows a similar excess in the C200 range.
m filters is
relatively straightforward. In general a good agreement better than 25%,
in particular for those maps with comparable sizes to the COBE/DIRBE beam, is
found. All larger deviations can be explained by the source structure which
is extended over the ISOPHOT map area, but compact inside the COBE/DIRBE beam.
The largest outlier shows a similar excess in the C200 range.
Without any correction, the ISOPHOT 90 ![]() m filter maps seem to show a
systematic positive surface brightness excess with regard to the DIRBE 100
m filter maps seem to show a
systematic positive surface brightness excess with regard to the DIRBE 100
![]() m photometry. However, inspection of the COBE/DIRBE SEDs indicates
a steep decline in flux between 60 and 100
m photometry. However, inspection of the COBE/DIRBE SEDs indicates
a steep decline in flux between 60 and 100 ![]() m. In fact, the 90
m. In fact, the 90 ![]() m
ISOPHOT values are practically always in between the 60 and 100
m
ISOPHOT values are practically always in between the 60 and 100 ![]() m
DIRBE values. Very often, the surface brightness ratio 60/100 is about 2,
i.e. with a linear interpolation between 60 and 100
m
DIRBE values. Very often, the surface brightness ratio 60/100 is about 2,
i.e. with a linear interpolation between 60 and 100 ![]() m, the 90
m, the 90 ![]() m
flux is by 25% higher than the 100
m
flux is by 25% higher than the 100 ![]() m flux due to the shape of the
SED. Then, also the surface brightness of the 90
m flux due to the shape of the
SED. Then, also the surface brightness of the 90 ![]() m maps are consistent
with COBE/DIRBE within the 25% level. If the discrepancy between the
ISOPHOT 90
m maps are consistent
with COBE/DIRBE within the 25% level. If the discrepancy between the
ISOPHOT 90 ![]() m surface brightness and the DIRBE 100
m surface brightness and the DIRBE 100 ![]() m surface
brightness is small, usually the source SED is reasonably flat between 60
and 100
m surface
brightness is small, usually the source SED is reasonably flat between 60
and 100 ![]() m.
Whether there is still a positive excess at 90
m.
Whether there is still a positive excess at 90 ![]() m cannot be solved
by this kind of study, but needs better matching areas and a proper colour
correction of the background SEDs.
m cannot be solved
by this kind of study, but needs better matching areas and a proper colour
correction of the background SEDs.
From the consistency found in the three filters at 60, 90 and 100 ![]() m
and the relative photometric accuracies of all ISOPHOT C100 filters, we
conclude that the consistency should also hold for the remaining ISOPHOT
filters at 65, 80 and 105
m
and the relative photometric accuracies of all ISOPHOT C100 filters, we
conclude that the consistency should also hold for the remaining ISOPHOT
filters at 65, 80 and 105 ![]() m.
The good correspondance holds for the flux range 4.5 to 400 MJy sr
m.
The good correspondance holds for the flux range 4.5 to 400 MJy sr![]() .
.
| OLP | surface | solid | DIRBE | DIRBE | solid | ||
| product | filter | brightness | angle | flux | filter | angle | consistency |
| name | [ |
[MJy sr |
[10 |
[MJy sr |
[ |
[10 |
[%] |
| 19002101 | 60 | 6.8 | 0.81 | 6.6 | 60 | 19.5 | +2.2 |
| 08900102 | 60 | 9.5 | 1.60 | 6.5 | 60 | 19.5 | +47 |
| 85001219 | 60 | 22.8 | 0.21 | 22.3 | 60 | 19.5 | +2.2 |
| 13400214 | 60 | 39.8 | 0.22 | 39.6 | 60 | 19.5 | +0.6 |
| 68300807 | 60 | 21.3 | 6.77 | 27.2 | 60 | 19.5 | |
| 84403913 | 60 | 23.9 | 1.04 | 24.5 | 60 | 19.5 | |
| 69801101 | 60 | 107.4 | 1.16 | 122.3 | 60 | 19.5 | |
| 35100809 | 90 | 5.1 | 5.49 | 3.3 | 100 | 19.5 | +55 |
| 58200903 | 90 | 11.8 | 3.06 | 12.9 | 100 | 19.5 | |
| 19201091 | 90 | 4.8 | 7.30 | 3.1 | 100 | 19.5 | +52 |
| 86901244 | 90 | 5.2 | 2.75 | 3.6 | 100 | 19.5 | +44 |
| 41502788 | 90 | 8.1 | 5.10 | 5.7 | 100 | 19.5 | +44 |
| 09000606 | 90 | 11.8 | 0.77 | 11.3 | 100 | 19.5 | +4.4 |
| 08901904 | 90 | 15.1 | 0.23 | 13.6 | 100 | 19.5 | +11 |
| 40100614 | 90 | 14.7 | 6.80 | 13.3 | 100 | 19.5 | +10 |
| 87001338 | 90 | 5.3 | 2.93 | 3.6 | 100 | 19.5 | +47 |
| 57501902 | 90 | 12.1 | 1.15 | 9.7 | 100 | 19.5 | +25 |
| 53700514 | 90 | 4.4 | 0.85 | 3.7 | 100 | 19.5 | +21 |
| 60002009 | 90 | 7.1 | 4.24 | 5.2 | 100 | 19.5 | +37 |
| 50000124 | 90 | 4.8 | 8.87 | 3.3 | 100 | 19.5 | +43 |
| 50100273 | 90 | 5.8 | 8.68 | 3.5 | 100 | 19.5 | +68 |
| 20701079 | 90 | 25.6 | 0.33 | 22.8 | 100 | 19.5 | +12 |
| 20800709 | 90 | 5.8 | 3.49 | 4.0 | 100 | 19.5 | +46 |
| 86800640 | 90 | 5.7 | 2.96 | 3.6 | 100 | 19.5 | +60 |
| 10101158 | 100 | 30.7 | 1.71 | 21.0 | 100 | 19.5 | +46 |
| 79401149 | 100 | 44.2 | 0.51 | 40.6 | 100 | 19.5 | +9.0 |
| 44900714 | 100 | 387.7 | 15.2 | 440.1 | 100 | 19.5 | -12 |
| 15601578 | 100 | 17.4 | 1.82 | 6.1 | 100 | 19.5 | +187 |
| 27600420 | 100 | 15.4 | 1.74 | 12.1 | 100 | 19.5 | +27 |
| 71901220 | 100 | 18.5 | 3.66 | 16.0 | 100 | 19.5 | +15 |
| 33401134 | 100 | 96.4 | 4.06 | 49.3 | 100 | 19.5 | +96 |
A similar analysis was also performed by Klaas et al. 2000,
[100] for ISOPHOT C200 maps. Since the longest COBE/DIRBE filters (140 and 240 ![]() m) have an internal uncertainty of 20 to 30%, for a subsample of maps with low dynamic range the average fluxes of a 1.5 degree circular area were used, which gives a more robust photometry
(this means averaging over 70 COBE/DIRBE pixels).
m) have an internal uncertainty of 20 to 30%, for a subsample of maps with low dynamic range the average fluxes of a 1.5 degree circular area were used, which gives a more robust photometry
(this means averaging over 70 COBE/DIRBE pixels).
In Table 6.9 we present the results of the comparison. No colour correction with regard to a modified blackbody describing the background spectral energy distribution nor a wavelength correction to better match the COBE/DIRBE filter central wavelength with the ISOPHOT filter central wavelength were performed. Again we have to remark that nearly all the ISOPHOT maps are considerably smaller in area than the solid angle of one COBE/DIRBE pixel. Therefore, structures in the source or background can affect the resulting absolute flux. In case of a flat field, the flux of the centred COBE/DIRBE pixel as well as the 3 degree circular area average is listed to give an impression of the variation of the background (and also the stability of the COBE/DIRBE measurement in one pixel). If the map contains a bright target and is smaller than the COBE/DIRBE pixel, then only the flux of the centred COBE/DIRBE pixel is given.
Taking into account the discrepancies in beam size and the non-correction
for different wavelengths of filters and background SEDs, the general
agreement is in the order of 20 to 30% at all four filters considered
(150, 170, 180 and 200 ![]() m). Restricting the comparison to
ISOPHOT maps with comparable solid angles with the COBE/DIRBE measurement,
the consistency is confirmed to be better than 25%. This holds for all
filters and a surface brightness range between 2.5 and 600 MJy sr
m). Restricting the comparison to
ISOPHOT maps with comparable solid angles with the COBE/DIRBE measurement,
the consistency is confirmed to be better than 25%. This holds for all
filters and a surface brightness range between 2.5 and 600 MJy sr![]() .
.
Larger deviations between the average ISOPHOT map flux and the COBE/ DIRBE flux only occur for bright central sources which are compact in comparison with the COBE/DIRBE beam. In these cases, the COBE/DIRBE fluxes are always less than the ISOPHOT fluxes, as expected.
| surface | solid | DIRBE | DIRBE | solid | |||
| OLP product | filter | brightness | angle | flux | filter | angle | consistency |
| name | [ |
[MJy sr |
[10 |
[MJy sr |
[ |
[10 |
[%] |
| 56200110 | 150 | 3.6 | 2.91 | 4.1 | 140 | 19.5 | |
| 56201814 | 150 | 22.2 | 0.42 | 20.9 | 140 | 19.5 | +6.2 |
| 08900103 | 150 | 5.5 | 1.26 | 7.7 | 140 | 19.5 | |
| 79400434 | 170 | 3.2 | 3.15 | 2.2 | 140 | 19.5 | +45 |
| 2.9 | 140 | 215.3 | +10 | ||||
| 59300101 | 170 | 3.5 | 6.53 | 3.5 | 140 | 19.5 | |
| 3.4 | 140 | 215.3 | +4.2 | ||||
| 19800208 | 170 | 3.2 | 3.41 | 5.0 | 140 | 19.5 | |
| 3.3 | 140 | 215.3 | |
||||
| 21001305 | 170 | 3.6 | 3.39 | 4.1 | 140 | 19.5 | |
| 3.5 | 140 | 215.3 | +3.4 | ||||
| 79900733 | 170 | 6.0 | 0.50 | 7.0 | 140 | 19.5 | |
| 33600108 | 180 | 2.7 | 2.50 | 2.7 | 140 | 19.5 | |
| 2.8 | 140 | 215.3 | |
||||
| 33600705 | 180 | 4.7 | 2.55 | 5.7 | 140 | 19.5 | |
| 5.7 | 140 | 215.3 | |
||||
| 35100907 | 180 | 4.1 | 4.92 | 4.5 | 140 | 19.5 | |
| 16701206 | 180 | 15.0 | 4.11 | 12.7 | 140 | 19.5 | +18 |
| 52700412 | 180 | 3.2 | 0.87 | 3.8 | 140 | 19.5 | |
| 3.2 | 140 | 215.3 | +0 | ||||
| 85001037 | 180 | 8.1 | 3.78 | 10.1 | 140 | 19.5 | |
| 9.3 | 140 | 215.3 | |
||||
| 78200101 | 200 | 6.3 | 28.40 | 5.3 | 240 | 34.45 | +20 |
| 36803005 | 200 | 14.8 | 0.71 | 15.5 | 240 | 19.5 | |
| 14.9 | 240 | 215.3 | |
||||
| 39602213 | 200 | 36.2 | 6.22 | 29.2 | 240 | 19.5 | +24 |
| 26101401 | 200 | 69.8 | 11.03 | 85.4 | 240 | 19.5 | |
| 33401133 | 200 | 138.6 | 3.89 | 87.6 | 240 | 19.5 | +58 |
| 86101801 | 200 | 251.9 | 5.01 | 287.9 | 240 | 19.5 | |
| 15601577 | 200 | 11.4 | 1.38 | 5.9 | 240 | 19.5 | +95 |
| 33300559 | 200 | 38.0 | 6.55 | 55.7 | 240 | 19.5 | |
| 10101157 | 200 | 69.7 | 1.41 | 45.2 | 240 | 19.5 | +54 |
| 31000625 | 200 | 345.4 | 1.45 | 207.8 | 240 | 19.5 | +66 |
| 26701013 | 200 | 593.3 | 15.49 | 494.5 | 240 | 19.5 | +20 |
| 40900802 | 200 | 6.9 | 1.97 | 5.6 | 240 | 19.5 | +23 |
| 28001303 | 200 | 13.0 | 2.00 | 12.8 | 240 | 19.5 | +1.6 |