The LWS Fabry-Pérot interferometers are fully described in Davis et al.
1995, [12] but for this section, which explains the
adopted strategy and the
results of the wavelength calibration, we can simply think of a
Fabry-Pérot
as two partially transmitting mirrors facing each other, a
distance ![]() apart.
apart.
Under simplifying assumptions the FP transmission has a maximum at
wavelength ![]() when:
when:
where ![]() is a positive integer called the 'order'.
Note that at separation
is a positive integer called the 'order'.
Note that at separation ![]() there are an infinity of transmitted wavelengths, namely
there are an infinity of transmitted wavelengths, namely ![]() ,
, ![]() ,
, ![]() and so on. To avoid contamination by undesired wavelengths the LWS FP
used the grating as an order sorter.
and so on. To avoid contamination by undesired wavelengths the LWS FP
used the grating as an order sorter.
In Equation 5.8 there are no free parameters so that
once ![]() and
and ![]() are known we can easily derive
are known we can easily derive ![]() without
needing a calibration. But the separation between mirrors was read out
by the on-board electronics in terms of a quantity, the FP encoded
position, whose relation with
without
needing a calibration. But the separation between mirrors was read out
by the on-board electronics in terms of a quantity, the FP encoded
position, whose relation with ![]() is known from ground calibration
to be a cubic function. So Equation 5.8 turns into:
is known from ground calibration
to be a cubic function. So Equation 5.8 turns into:
Being the result of a digital measurement, ![]() is an integer running
from 0 to 4095. Wavelength calibration means then deriving the four
coefficients of the above polynomial.
is an integer running
from 0 to 4095. Wavelength calibration means then deriving the four
coefficients of the above polynomial.
Let us assume that we have observed a number of lines at wavelengths
![]() and found their centres5.1
and found their centres5.1 ![]() . We can not directly invert
Equation 5.9 to find the unknown coefficients because we
still miss the orders
. We can not directly invert
Equation 5.9 to find the unknown coefficients because we
still miss the orders ![]() . So that the first step is to observe the
same line in at least two adjacent orders, say
. So that the first step is to observe the
same line in at least two adjacent orders, say ![]() and
and ![]() .
.
The AOT logic selected for each wavelength one single order, so to observe
the same line at different orders we executed special dedicated
observations (COIF). Having determined the centres ![]() and
and ![]() for
the two orders we recast Equation 5.9 in a different form:
for
the two orders we recast Equation 5.9 in a different form:
After observing lines in different orders a first estimate of the coefficients is obtained with a least squares fit. Now we rewrite Equation 5.9 in the following way:
where ![]() refers to a given wavelength observed at order
refers to a given wavelength observed at order ![]() . All the
. All the
![]() 's must be integer so that the value of
's must be integer so that the value of ![]() which minimises the
differences
which minimises the
differences
![]() is looked for. Once
is looked for. Once ![]() is
found Equation 5.9 is used to determine the order
is
found Equation 5.9 is used to determine the order ![]() and finally all four coefficients can be derived at the same time,
again using a least squares fit.
and finally all four coefficients can be derived at the same time,
again using a least squares fit.
To find the centre of a line three algorithms can be used and are now briefly described.
The three techniques are completely independent of each other and give us a
better estimate of the centre position and its error, defined as
![]() with
with
![]() being the average of the three values
being the average of the three values ![]() .
.
However, the FP wavelength calibration was carried out according to the procedure described in the previous section and uses only the first method described below. All three techniques have been used for the monitoring programme discussed later.
At each point the segment that intersects the line is found and the half-power point computed. The 10 half-power points are then averaged. The procedure, fully described in the LWS Calibration File Derivation Procedure, gives as output:
GAUSSFIT has been used. It simultaneously
fits the background and the line profile so from this point of
view it is the
best of the three methods presented. The procedure gives the line
centre, peak height and FWHM. In all cases the FP line profile
is definitively
not Gaussian, being the convolution of the source intrinsic
profile and an Airy function so that only the centre position
is reliable.
Experience has shown that even at low signal-to-noise ratio, the three line centres very rarely differ by more than one FP encoded position.
Lines and sources observed to calibrate the short wavelength FP
(FPS, covering from
![]() m to
m to ![]() m) and for the long wavelength
FP (FPL, covering from
m) and for the long wavelength
FP (FPL, covering from ![]() m to
m to ![]() m)
are reported in Table 5.17. The
derived coefficients are written in Table 5.18.
m)
are reported in Table 5.17. The
derived coefficients are written in Table 5.18.
| Source | Rev. | Ion | Line | Orders | |
| [ |
|||||
| FPS | NGC 7027 | 168 | [O I] | 63.2 | 87, 88 |
| G 36.3+0.7 | 300 | [O III] | 51.8 | 104, 105, 106 | |
| G 0.6 |
321 | [O III] | 51.8 | 105, 106 | |
| NGC 7027 | 370 | [O I] | 63.2 | 88, 89 | |
| FPL | NGC 7027 | 175 | [O I] | 145.5 | 69, 70 |
| G 0.6 |
287 | [O III] | 88.4 | 114, 115 | |
| G 36.3+0.7 | 300 | [O III] | 88.4 | 114, 115 |
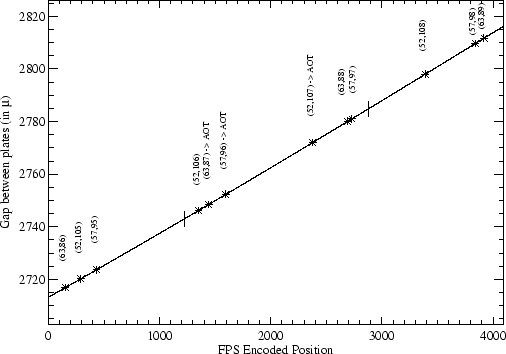
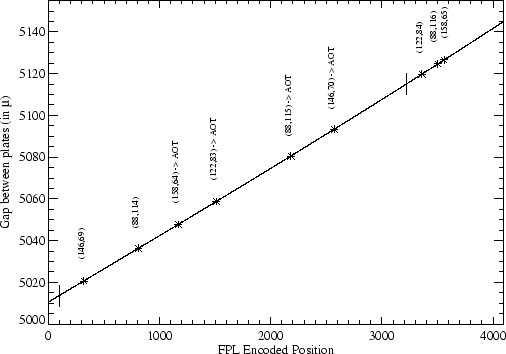
In Figure 5.25 the relation between encoded position
and gap between plates is shown as a solid line for both FPS and FPL.
Asterisks mark the positions
where a particular combination ![]() falls. The combinations
actually selected by the AOT logic are indicated. All wavelengths
observable with FPS correspond to a particular position inside the portion
of the curve delimited by two vertical segments.
falls. The combinations
actually selected by the AOT logic are indicated. All wavelengths
observable with FPS correspond to a particular position inside the portion
of the curve delimited by two vertical segments.


|
| FPS | FPL | |
| A | 2713.2569 | 5010.6224 |
| B | 0.023870650 | 0.031654363 |
|---|---|---|
| C | 4.1581366 10 |
7.3574580
10 |
| D | |
5.1097999
10 |
To check the stability of the calibration against possible temporal trends, weekly observations have been performed on a number of selected sources, chosen according to their luminosity, visibility and with as small FWHM as possible. Lines and sources used for this task are listed in Table 5.19.
| Ion | Line | FP | Source |
| [ |
|||
| [O III] | 51.8 | S | G 0.6 |
| [N III] | 57.3 | S | NGC 3603, G 0.6 |
| [O I] | 63.2 | S | NGC 7023, NGC 7027, NGC 7538, S106 |
| [O III] | 88.4 | L | G 0.6 |
| [N II] | 121.9 | L | G 0.6 |
| [O I] | 145.5 | L | NGC 7023, NGC 7027 |
| [C II] | 157.7 | L | G 0.6 |
| NGC 7538, S106 |
Each line has been fitted with the methods previously described so that its centre is the average of three values. It has been converted into wavelength using Equation 5.9 and taking into account the relative motion of the source with respect to the satellite.
The calibration looks stable with no temporal trend. Note that
the [N III]
line was not used to derive the calibration coefficients, so that we
can use our data to measure its rest wavelength. Combining all 11
measurements we get
![]() m, in
perfect agreement with the quoted value in the literature (
m, in
perfect agreement with the quoted value in the literature (![]() m). In
Table 5.20 the rms error for each wavelength is reported.
m). In
Table 5.20 the rms error for each wavelength is reported.
| Ion | Line | Error | |
| [ |
[km s |
||
| [O III] | 51.8 | 9.5 | 5.5 |
| [N III] | 57.3 | 7.2 | 3.8 |
| [O I] | 63.2 | 8.7 | 4.1 |
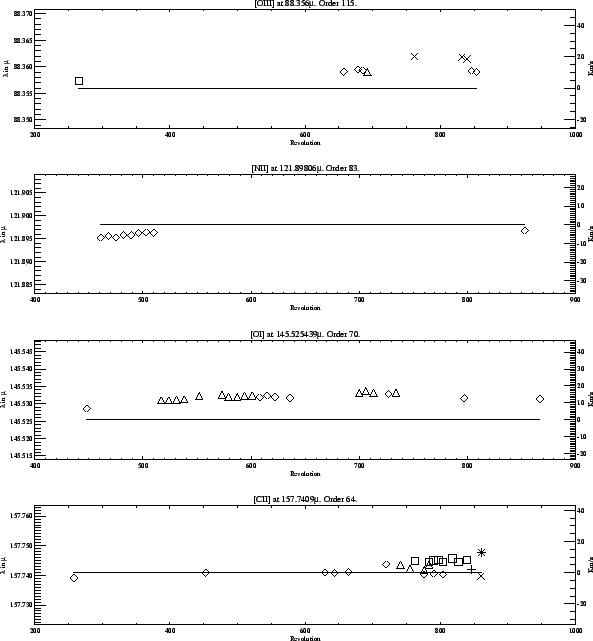
Figure 5.26 illustrates
the monitoring of the FPL wavelength
accuracy. As can be seen, especially in the plot corresponding to the
[O I]
line at 145.5 ![]() m, the calibration seems to be
affected by systematic errors. But even in the worst case errors are lower
than half a spectral resolution element.
m, the calibration seems to be
affected by systematic errors. But even in the worst case errors are lower
than half a spectral resolution element.

|
The rms errors are reported in Table 5.21. Note that when the measured wavelength is systematically shifted with respect to the rest wavelength, the rms is a measure of the average displacement and not a true scatter around the mean.
| Ion | Line | Error | |
| [ |
[km s |
||
| [O III] | 88.4 | 1.5 | 5.1 |
| [N II] | 121.9 | 2.2 | 5.4 |
| [O I] | 145.5 | 6.6 | 13.6 |
| [C II] | 157.7 | 3.0 | 5.6 |
As is clear from Equation 5.8 or 5.9 in
Section 5.12, what we measure is the distance ![]() and not the wavelength
and not the wavelength ![]() . For this reason the
accuracy of the calibration depends on which FP position range was used to
observe a given line. This information is written in LSPD files.
. For this reason the
accuracy of the calibration depends on which FP position range was used to
observe a given line. This information is written in LSPD files.
Looking at Figure 5.25 (top) and Table 5.20
we conclude that the accuracy of the wavelength calibration for FPS
is ![]() 4km s
4km s![]() at positions
at positions
![]() , slightly increasing to
, slightly increasing to ![]() 6 km s
6 km s![]() at larger values
of
at larger values
of ![]() . A
reasonable choice for error over the range of positions is then
. A
reasonable choice for error over the range of positions is then
![]() .
.
In the case of FPL the
range covered by the instrument is larger. From Figure 5.25
(bottom) and Table 5.21 it is evident that a
systematic error
is present in the calibration, increasing towards larger ![]() values.
values.
For the validation of OLP Version 10 data, the accuracy of lines was
studied in NGC 7027 for 21 observations. Excluding the 145.5 ![]() m
[O I] line, the overall rms error was 2.69 km s
m
[O I] line, the overall rms error was 2.69 km s![]() . Measurements
of the 145.5
. Measurements
of the 145.5 ![]() m line were made during orbits 601, 706, 713 and 734.
If the rest wavelength is taken to be 145.525
m line were made during orbits 601, 706, 713 and 734.
If the rest wavelength is taken to be 145.525 ![]() m then the velocity
residuals of these measurements are +16.1, +20.7, +18.2 and +18.2
km s
m then the velocity
residuals of these measurements are +16.1, +20.7, +18.2 and +18.2
km s![]() ,
which makes the overall rms error 4.42 km s
,
which makes the overall rms error 4.42 km s![]() . However, if a value
of 145.535
. However, if a value
of 145.535 ![]() m is used, the velocity residuals are
m is used, the velocity residuals are ![]() 4.50, +0.11,
4.50, +0.11,
![]() 2.37 and
2.37 and ![]() 2.37 km s
2.37 km s![]() , and the overall rms error is only
2.65 km s
, and the overall rms error is only
2.65 km s![]() .
.
This discrepancy in the measurement of the 145.5 ![]() m line of
NGC 7027 suggests that either:
m line of
NGC 7027 suggests that either:
![]() this line
arises from a region which has a different velocity signature
compared to the other lines measured in NGC 7027.
This is plausible given the complex nature of NGC 7027
(see Phillips et al. 1991, [32]).
However, the [O I] line at 63.2
this line
arises from a region which has a different velocity signature
compared to the other lines measured in NGC 7027.
This is plausible given the complex nature of NGC 7027
(see Phillips et al. 1991, [32]).
However, the [O I] line at 63.2 ![]() m observed with FPS did
not show such high residuals in FPS, which makes this hypothesis
difficult to believe.
m observed with FPS did
not show such high residuals in FPS, which makes this hypothesis
difficult to believe.
![]() the 145.525
the 145.525 ![]() m rest wavelength, the value used when deriving
the wavelength calibration, is inaccurate.
m rest wavelength, the value used when deriving
the wavelength calibration, is inaccurate.
A literature search has shown there are two different values recorded
as the rest wavelength for the 145.5 ![]() m [O I] line:
m [O I] line:
![]() 145.525
145.525 ![]() m, from
the NASA's Jet Propulsion Laboratory Spectral Catalog
m, from
the NASA's Jet Propulsion Laboratory Spectral Catalog
-- see http://spec.jpl.nasa.gov/ and Zink et al. 1991,
[47]
![]() 145.535
145.535 ![]() m, from The National Institute of Standards and
Technology
m, from The National Institute of Standards and
Technology
-- see http://www.nist.gov/.
The difference of 0.010 ![]() m between both values is equivalent
to 21km s
m between both values is equivalent
to 21km s![]() .
In any case, until this ambiguity is resolved,
users should view their line velocity measurements of the
145.5
.
In any case, until this ambiguity is resolved,
users should view their line velocity measurements of the
145.5 ![]() m [O I] line with caution.
m [O I] line with caution.
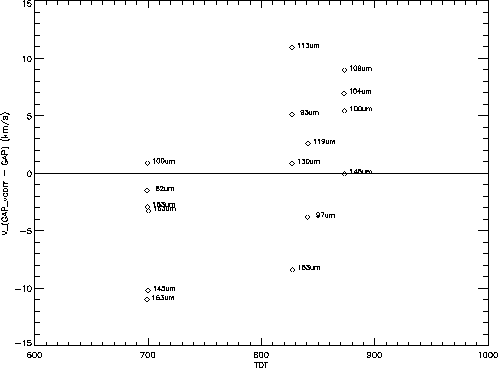
Another systematic check of the accuracy of the FPL calibration was made
using 16 CO lines observed in Orion BN/KL between revolutions 699 and 873.
The systematic error indicated
above was evident, but to a lesser extent. Once the source velocity
was subtracted (+ 9 ![]() km s
km s![]() , Knapp et al. 1981,
[23]), the residual velocity differences
(i.e. observed wavelength minus rest wavelength, expressed as
velocity) have an rms of 6 km s
, Knapp et al. 1981,
[23]), the residual velocity differences
(i.e. observed wavelength minus rest wavelength, expressed as
velocity) have an rms of 6 km s![]() and are never worse than
and are never worse than
![]() 11 km s
11 km s![]() ,
as shown in Figure 5.27.
This figure can provide some guidance to users on the magnitude
and time-dependent nature of systematic errors observed in
well calibrated LWS FPL data.
,
as shown in Figure 5.27.
This figure can provide some guidance to users on the magnitude
and time-dependent nature of systematic errors observed in
well calibrated LWS FPL data.

|
For the accuracy of FPL measurements, we therefore adopted the
most conservative value, half of the spectral resolution element or
13km s![]() even if the internal
scatter of data points seem to imply that a better accuracy
could potentially be achieved. For FPS data the accuracy adopted is
even if the internal
scatter of data points seem to imply that a better accuracy
could potentially be achieved. For FPS data the accuracy adopted is
![]() of a spectral resolution element or 6 km s
of a spectral resolution element or 6 km s![]() .
.