The calibration of the parallel and serendipity modes can be checked in various ways:
Table 5.23 lists five L01 observations which were selected to provide a direct cross-check between parallel and prime mode. All L01 positions lie within the parallel rasters with the two Galactic Centre pointings being exactly coincident with one of the raster positions.
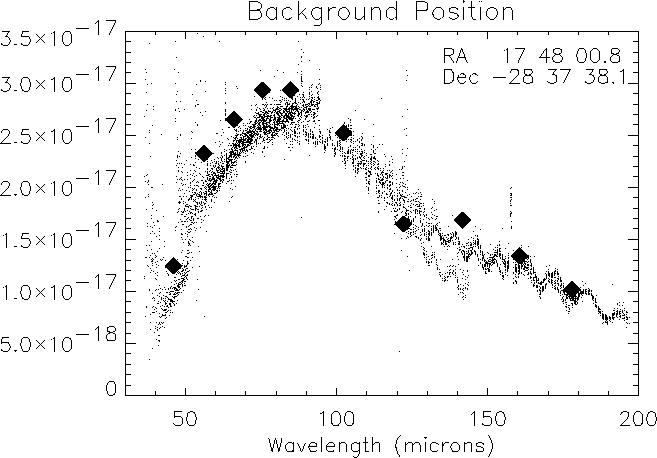
Figure 5.28 shows the Galactic Centre background position
where the pointing is the same for the prime and parallel mode
observations. For all positions the agreement is generally better than
20%. This result was obtained by comparing the fluxes from
each detector at the parallel wavelengths with the prime data at those
specific wavelengths. The best agreement was in the Galactic Centre position
with the maximum flux. The first position in ![]() Oph, which is in a
low flux region, showed the worst agreement. The uncertainties in dark
current affect the quality of the data; hence, this result meets
expectations. There were no systematic differences found,
although detectors SW1
and SW2 could be more than a factor of two higher or lower than the prime
mode. For the interpolated positions all other detectors were well
within a factor of two of the prime mode.
Oph, which is in a
low flux region, showed the worst agreement. The uncertainties in dark
current affect the quality of the data; hence, this result meets
expectations. There were no systematic differences found,
although detectors SW1
and SW2 could be more than a factor of two higher or lower than the prime
mode. For the interpolated positions all other detectors were well
within a factor of two of the prime mode.

|
| TDT | RA | Dec | Source |
| 29502313 | 16 25 43.5 | ||
| 48400517 | 16 27 02.0 | ||
| 29200534 | 16 26 26.3 | ||
| 69601005 | 17 48 00.8 | Gal. Centre background | |
| 69600801 | 17 46 42.5 | Gal. Centre |
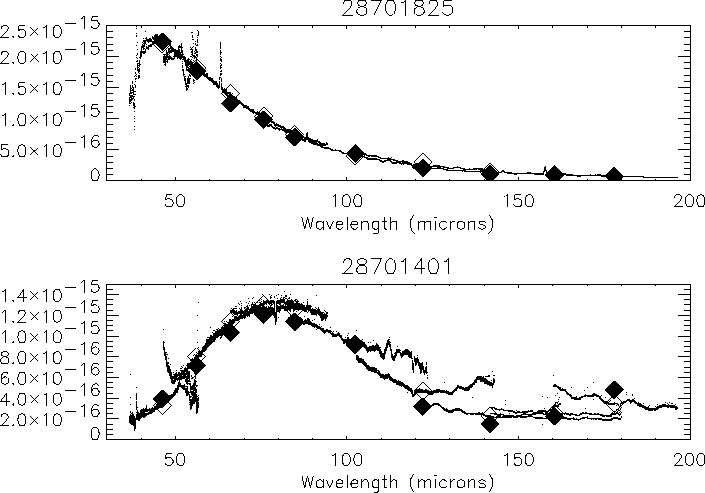
Before LWS prime mode observations are performed, there are between 10-20 ramps in the previous serendipity product, for which the on-target flag is OK, the pointing is stabilised and serendipity mode is still active. The fluxes obtained from these ramps can be compared to those obtained from the prime mode at the same grating position to check on how accurately the serendipity fluxes are being derived. In principle this can be done for every prime grating mode observation of a non-moving source. This check was performed on ten observations selected to have varying properties e.g. flux, source extent, etc. The agreement is very good when looking at bright point sources (see Figure 5.29; TDT 28701825) but less good when looking at bright extended sources (see Figure 5.29; TDT 28701401) and faint sources. It is also interesting to note that in the latter case, the LW2-LW4 detectors are saturated in prime mode and saturation effects are also present in the stabilisation period. The parallel flux is usually within 20% of the prime mode flux and there are no systematic deviations except for detector LW1 which was often about 30-40% lower in serendipity mode than in prime mode.

|
The parallel mode interactive analysis (LPIA) enables the building of a map
from constituent product files using linear interpolation to form a uniform
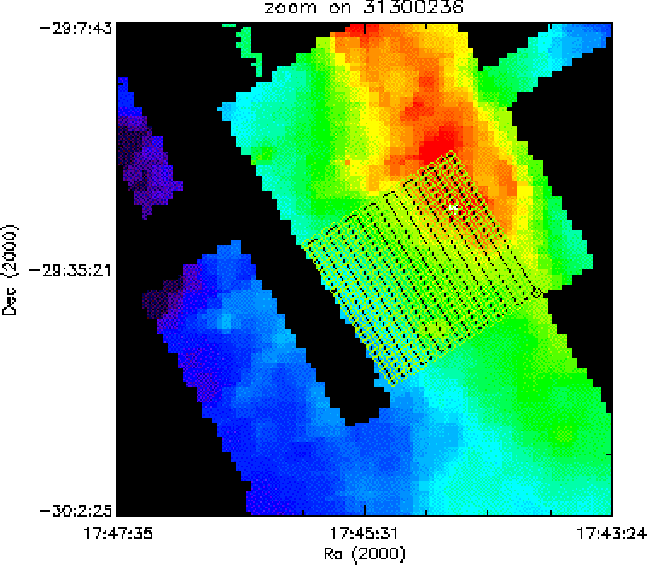
grid. Figure 5.30 shows one example where a map has been
generated from about 15 large (![]() 30 points) rasters and 32 other
parallel observations. The raster pointings superposed on this map are
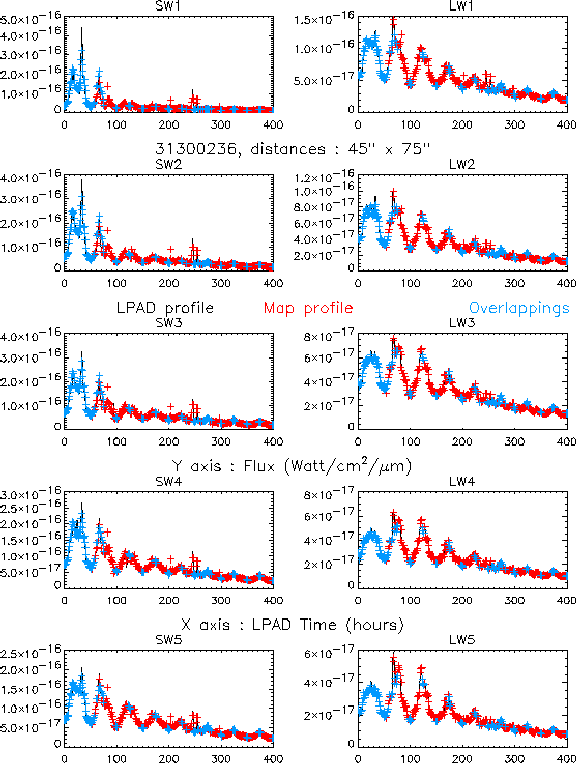
from TDT 31300236 and the fluxes obtained at each point, both in the map
and the constituent raster are shown in Figure 5.31.
Each individual point from the raster was ratioed with the nearest
point in the map (i.e. for TDT 31300236, 401 ratios were obtained per
detector) and these were averaged to get one comparison value for that
detector per observation. This comparison was tried in three other
areas (TDTs 32201917, 31201606 and 64102109) and the average
ratio was always found to be within 20% with the majority of
ratioes well within 10%.
30 points) rasters and 32 other
parallel observations. The raster pointings superposed on this map are
from TDT 31300236 and the fluxes obtained at each point, both in the map
and the constituent raster are shown in Figure 5.31.
Each individual point from the raster was ratioed with the nearest
point in the map (i.e. for TDT 31300236, 401 ratios were obtained per
detector) and these were averaged to get one comparison value for that
detector per observation. This comparison was tried in three other
areas (TDTs 32201917, 31201606 and 64102109) and the average
ratio was always found to be within 20% with the majority of
ratioes well within 10%.

|

|
In addition to checking the internal calibration, comparisons can be made
also with IRAS and ISOPHOT. For each of these other instruments the
comparison is difficult to interpret as the flux obtained from LWS parallel
observations covers a very narrow spectral band whereas the other
instruments are observing a much broader spectral range. In spite of this,
one important aspect which can be addressed by comparing LWS parallel data
with data from other instruments, and which cannot be
discerned with the internal checks, is to see if the beam shapes used for
the conversion from
![]() to
to ![]() are reasonable. Maps were generated covering the
are reasonable. Maps were generated covering the ![]() Oph region
and compared with IRAS High-Res maps, at
Oph region
and compared with IRAS High-Res maps, at ![]() m (with those of
SW2 at
m (with those of
SW2 at ![]() m and SW3 at
m and SW3 at ![]() m) and
m) and ![]() m
(with SW5 at 84.8
m
(with SW5 at 84.8 ![]() m, LW1 at
m, LW1 at ![]() m and LW2 at 122.1
m and LW2 at 122.1 ![]() m).
The comparison was made by selecting linear strips across
m).
The comparison was made by selecting linear strips across ![]() Oph and
looking at the profiles along those strips. The difference between the
instruments was no more than 10%. At
Oph and
looking at the profiles along those strips. The difference between the
instruments was no more than 10%. At ![]() m SW2 profiles almost
exactly matched the IRAS profile
and the SW3 profile was always higher indicating that the effective
wavelength of the IRAS filter may be nearer the SW2 wavelength than SW3.
At
m SW2 profiles almost
exactly matched the IRAS profile
and the SW3 profile was always higher indicating that the effective
wavelength of the IRAS filter may be nearer the SW2 wavelength than SW3.
At ![]() m LW1 gave a very good match (difference
m LW1 gave a very good match (difference ![]() 5%) and
SW5 (
5%) and
SW5 (![]() m) was higher, while LW2 (
m) was higher, while LW2 (![]() m) and the
PHOT (
m) and the
PHOT (![]() -
-![]() m) filter were lower. LW2 is the only detector in
parallel mode where the wavelength is coincident with a strong
([N II]) line; therefore, we do not expect good agreement with IRAS
as the IRAS
m) filter were lower. LW2 is the only detector in
parallel mode where the wavelength is coincident with a strong
([N II]) line; therefore, we do not expect good agreement with IRAS
as the IRAS ![]() m filter only has a 20% transmission at
m filter only has a 20% transmission at ![]() m.
m.