|
FP_PROC, which only dealt
with prime detector data.
This procedure has been updated to allow the use of the non-prime detectors,
as described in detail in Polehampton 2001, [34].

|
In the LIA routine FP_PROC all ten
detectors appear in a menu bar at the top of the screen. This allows
non-prime
data to be selected and processed in the same way as prime data. In order to
process all non-prime detectors the FP throughput calibration was
extended to cover wavelengths outside each FP's nominal range. The detectors
within each FP's nominal range are shown in Table 6.3.
| FPS | SW1 SW2 SW3 |
| FPL | SW4 SW5 LW1 LW2 LW3 LW4 LW5 |

|
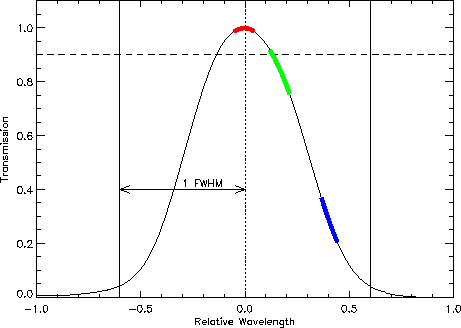
As a general guide to know how good a mini-scan is (see Figure 6.14), we define it as `useful' if it had at least one data point located above 90% of the maximum transmission of the grating. Assuming that the grating profile was approximately Gaussian, the 90% level occurred at a distance from the profile centre of:
| (6.4) |
where ![]() is the full width at half maximum of the grating profile. This
gives a cut-off distance of
is the full width at half maximum of the grating profile. This
gives a cut-off distance of ![]() =0.195
=0.195 ![]() from the profile centre.
This limit
ensures that most of the prime data are defined as having good
signal-to-noise. This limit is nevertheless only meant to give an indication.
Some mini-scans might not meet the `useful' data criteria and still be
good to use, only with a slightly lower signal-to-noise ratio.
from the profile centre.
This limit
ensures that most of the prime data are defined as having good
signal-to-noise. This limit is nevertheless only meant to give an indication.
Some mini-scans might not meet the `useful' data criteria and still be
good to use, only with a slightly lower signal-to-noise ratio.
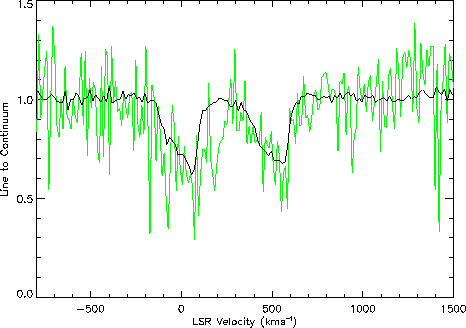
A good demonstration of the improvement that can be achieved using
non-prime data is
illustrated in Figure 6.15 showing a comparison of
prime and non-prime data for the 53 ![]() m OH lines
in Sgr B2 (from Polehampton 2002, [33]).
m OH lines
in Sgr B2 (from Polehampton 2002, [33]).

|