For the purpose of filtering out poor quality data, a number of conditions had to be met by the observations for them to be considered for the calibration. The first condition is that the reconstructed pointing had to be within 1 arcsecond of the intended coordinates. The second condition is that an observation was usable, only if it had high quality data in all the elements of the calibration group. For calibration purposes only, the bands are divided into 4 groups. Group 1 consisted of the short wavelength (SW) section of SWS (bands 1A, 1B, 1D, 1E, 2A, 2B and 2C). Group 2, consisted of bands 3A, 3C and 3D. Group 3 is just band 3E and group 4 is just band 4. The reason for creating these groups is that if and observation failed in any one part of a group, it is suspect in all the others. The final condition is that all points marked as glitches are thrown out. Unfortunately, this filter will not get the glitch tails seen in band 4 (see Section 7.2.8).
Table 5.2 gives an overview of the ACSs used for the photometric calibration of the pipeline products. The table indicates the source name, type of object, and bands which made use of the ACS.
The last 4 columns illustrate the diversity and distribution of
observations used for the photometric calibration of the various
bands. For each ACS, the number of observations
going into the photometric calibration is given. In the last columns,
there are 4 numbers per ACS indicating 4 different band groups. The
first group combines bands 1A through 2C, the second group
combines bands 3A through 3D, and the last two groups are the
bands 3E and 4 respectively. For wavelengths shorter than 12 ![]() m,
the SEDs for the ACS were updated with stellar atmospheric models
described in Decin 2000, [4]. The absolute calibration
of these SEDs is based on the photometry used for the absolutely
calibrated composite observed spectra described by Cohen et al. 1992a,
[2]. For wavelengths longer that 12
m,
the SEDs for the ACS were updated with stellar atmospheric models
described in Decin 2000, [4]. The absolute calibration
of these SEDs is based on the photometry used for the absolutely
calibrated composite observed spectra described by Cohen et al. 1992a,
[2]. For wavelengths longer that 12 ![]() m the
stellar composites themselves are used (Cohen et al. 1992a,
[2]). The photometry and composites used for SWS
are directly traceable to the published calibrated spectra of Sirius
and Vega (Cohen et al. 1992b, [3]).
m the
stellar composites themselves are used (Cohen et al. 1992a,
[2]). The photometry and composites used for SWS
are directly traceable to the published calibrated spectra of Sirius
and Vega (Cohen et al. 1992b, [3]).
The stellar calibration sources span a wide range in spectral types from A0V to M0III with the bulk of the sources being K giants. Within each of the SW bands the SEDs cover more than 2 decades in flux. The diversity of the ACSs and the wide flux range increases the reliability of the photometric calibration and reduces the sensitivity to any one object or model.
For bands 3E and 4, models of Ceres (T. Müller, private communication) and Uranus (E. Lellouch, private communication) were used. These models can be obtained from the ISO Data Centre.
As can be seen in Table 5.2, the star,
![]() Dra, was heavily used. The photometric calibration was
checked with and without the inclusion of
Dra, was heavily used. The photometric calibration was
checked with and without the inclusion of ![]() Dra to ensure
this one source was not skewing the photometric calibration.
Dra to ensure
this one source was not skewing the photometric calibration.
| Source | Alias | Spectral | Number Obs. | |||
| ID | Type | SW |
3 |
3E | 4 | |
| HR7001 | Vega | A0V | 5 | 0 | 0 | 0 |
| HR2491 | Sirius | A1V | 5 | 5 | 0 | 0 |
| HR4534 | A3Vv | 2 | 0 | 0 | 0 | |
| HR5459 | G2V | 1 | 1 | 1 | 1 | |
| HR7310 | G9III | 2 | 0 | 0 | 0 | |
| HR6688 | K2III | 4 | 0 | 0 | 0 | |
| HR5340 | K2IIIp | 8 | 9 | 9 | 9 | |
| HR5563 | K4III | 2 | 0 | 0 | 0 | |
| HR1457 | K5III | 6 | 6 | 6 | 6 | |
| HR6166 | HD 149447 | K5III | 1 | 0 | 0 | 0 |
| HR6705 | K5III | 24 | 37 | 29 | 0 | |
| HR337 | M0III | 4 | 4 | 4 | 2 | |
| HR911 | M2III | 2 | 2 | 2 | 0 | |
| HR8775 | M2.5III | 0 | 7 | 7 | 7 | |
| HR4763 | M4III | 0 | 6 | 6 | 6 | |
| NML Cyg | IRC+10448 | M6IIIe | 0 | 4 | 3 | 3 |
| Ceres | 210001 | Asteroid | 0 | 0 | 1 | 1 |
| Uranus | Planet | 0 | 0 | 1 | 1 | |
Table 5.3 lists the ![]() uncertainties in
the measured signal to flux conversion factors. For each grating
band the table lists the key wavelength of the band, the
bandpass used around the key wavelength, the
uncertainties in
the measured signal to flux conversion factors. For each grating
band the table lists the key wavelength of the band, the
bandpass used around the key wavelength, the ![]() accuracy at
the key wavelength, and the
accuracy at
the key wavelength, and the ![]() worst accuracy within the
band which is usually at the edges of the band. As calculated, the uncertainty
is the total absolute uncertainty which has accumulated factors from
each of the calibration steps plus estimated contributions from processes
which
were unprobed or uncorrected. Some examples of these additional
uncertainties are, uncorrected memory effects in band 4, higher
order memory effects in band 2, and pointing effects. See Section
5.9 for a complete description of the
uncertainties in the SWS data.
worst accuracy within the
band which is usually at the edges of the band. As calculated, the uncertainty
is the total absolute uncertainty which has accumulated factors from
each of the calibration steps plus estimated contributions from processes
which
were unprobed or uncorrected. Some examples of these additional
uncertainties are, uncorrected memory effects in band 4, higher
order memory effects in band 2, and pointing effects. See Section
5.9 for a complete description of the
uncertainties in the SWS data.
| Key |
Bandpass | Accuracy | Worst | ||
| Band | [ |
[ |
1 |
1 |
of worst |
| 1A | 2.48 | 0.05 | 4 | 7 | edges |
| 1B | 2.87 | 0.07 | 4 | 5 | edges |
| 1D | 3.08 | 0.07 | 4 | 5 | edges |
| 1E | 3.80 | 0.10 | 4 | 5 | edges |
| 2A | 4.50 | 0.10 | 7 | 10 | 6 |
| 2B | 5.90 | 0.20 | 7 | 9 | edges |
| 2C | 7.70 | 0.20 | 7 | 8 | edges |
| 3A | 14.0 | 0.30 | 12 | 14 | 12 |
| 3C | 17.0 | 0.30 | 10 | 13 | edges |
| 3D | 24.0 | 0.60 | 13 | 16 | 19.5 |
| 3E | 28.5 | 0.60 | 17 | 21 | edges |
| 4 | 32.0 | 0.60 | 22 | 23 | edges |
| 5A | 11.8 | 0.01 | 23 | 23 | |
| 5B | 14.0 | 0.01 | 23 | 23 | |
| 5C | 17.0 | 0.01 | 23 | 23 | |
| 5D | 24.0 | 0.01 | 24 | 24 | |
| 6 | 27.0 | 0.01 | 30 | 30 |
The accuracies listed in Table 5.3 are
entirely consistent
with our current knowledge of SWS and the ISO satellite. A pointing accuracy
of 1.5-2" (1![]() ) will produce more than half of the uncertainty in
photometry for bands 1 and 3 and contribute up to half of the uncertainty in
bands 2 and 4.
) will produce more than half of the uncertainty in
photometry for bands 1 and 3 and contribute up to half of the uncertainty in
bands 2 and 4.
The accuracy expected on the flux calibration of the Fabry-Pérot are the same as that on the grating, but an extra 20% uncertainty needs to be added due to wavelength dependent leakage.
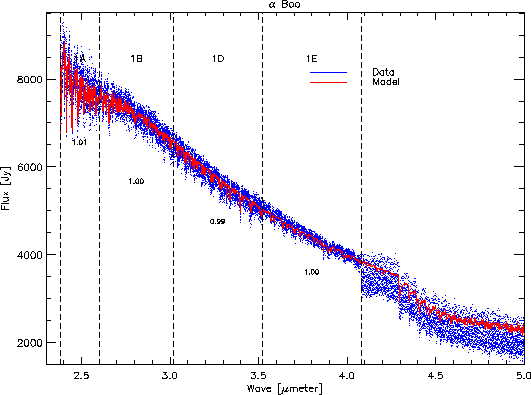
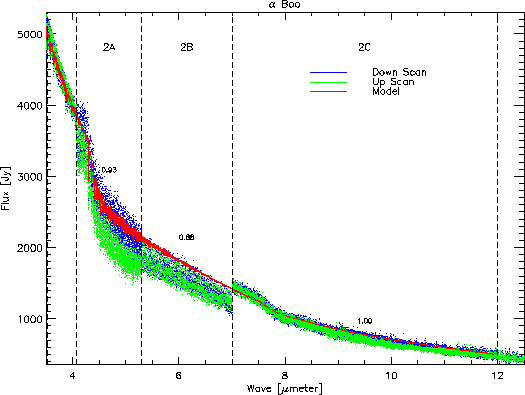
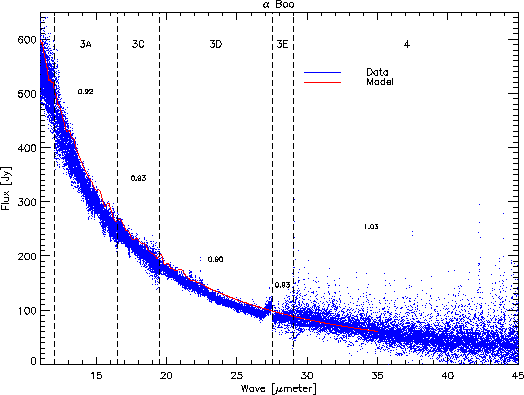
Figures 5.30 to 5.32
show examples of fully calibrated spectra for ![]() Boo. Each
spectral segment is made up of 12 detectors. The signal from these
12 detectors is kept separate to demonstrate the flat-fielding. The
SED for
Boo. Each
spectral segment is made up of 12 detectors. The signal from these
12 detectors is kept separate to demonstrate the flat-fielding. The
SED for ![]() Boo is overlaid in red. In Figure
5.31, the up
and down scans are shown separately to show the influence of residual
memory effects. Figure
5.32 shows bands 3 and 4. In this figure
radiation hits (glitches) are quite prevalent in band 4. The
residual memory effect introduced by a radiation hit can artificially
increase the signal.
Also listed in the figures are the ratios of the data to the model
at the key wavelength for each of the bands.
Boo is overlaid in red. In Figure
5.31, the up
and down scans are shown separately to show the influence of residual
memory effects. Figure
5.32 shows bands 3 and 4. In this figure
radiation hits (glitches) are quite prevalent in band 4. The
residual memory effect introduced by a radiation hit can artificially
increase the signal.
Also listed in the figures are the ratios of the data to the model
at the key wavelength for each of the bands.

|

|

|