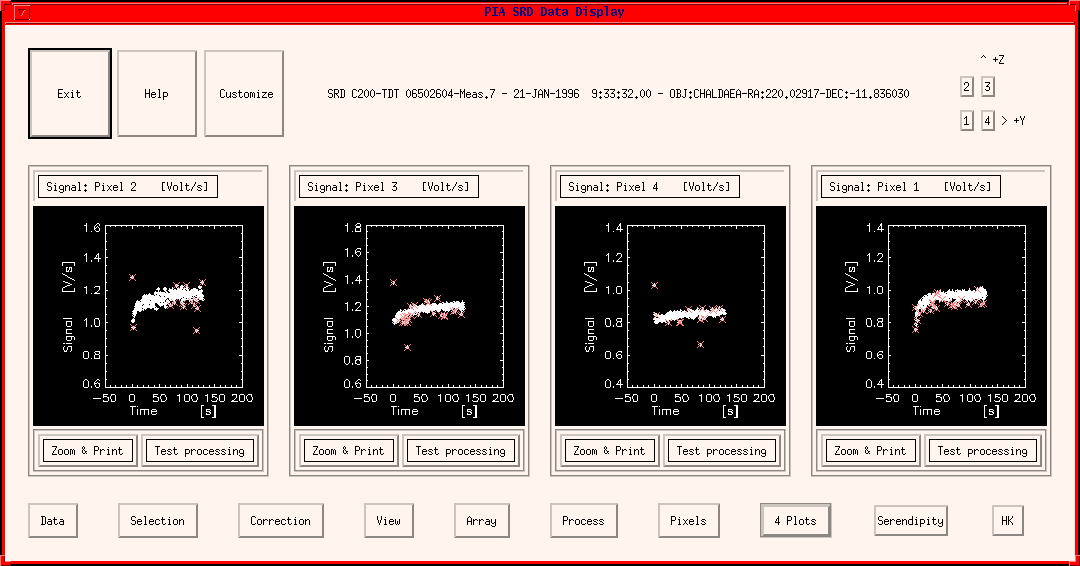
This chapter describes the PIA SRD Data Display window and directly associated sub-windows.
Basically, the SRD window (Figure 1) is divided into three rows:
Remark on Upper and Middle Row:
Since the upper row and the middle row are very similar to those of the ERD Window, the user is referred to the ERD description with the following differences for the middle row:
Data
This menu bar calls a submenu with the following options:
- Load: This calls the window Please Select a Measurement in order to load a new measurement into the SRD window, activating it for plotting and reduction. The measurement which was displayed still remains in the buffer, but is deactivated from this window.
- Save:
- To SRD buffer: this option can be used for putting the modified data present on the window into the dynamic buffer, together with all the modifications. The same position in the buffer can be used, thus overwriting the data which entered the window, or a new position, creating a new measurement in the general buffer. This allows for a re-call of the corrected data in a later stage, opening again the SRD window.
- to PIA internal file: this calls the Please Select a File for Writing window and asks a filename (and directory) under which the data shall be saved (a default name is proposed) in internal PIA format. This gives the possibility of saving several times the same measurement differently corrected, avoiding confusion (several versions in the case of VMS files) or overwriting (in the case of UNIX).
If the associated Compact Status file with the appropriate filename is not found in the directory chosen for saving the file, then it will automatically be saved, also in internal format. This makes it possible to reload the data in a later session without loading the data from the FITS files.- to FITS external file: this saves the measurement in FITS format under the default name into the actual save directory.
- Show Data: This calls the Show Structures - Plot Curves Menu (s.3.4.4) for complete access to the measurement buffer, allowing the user to make plots, establish correlations, etc.
Selection
This menu bar calls a submenu with the single option:
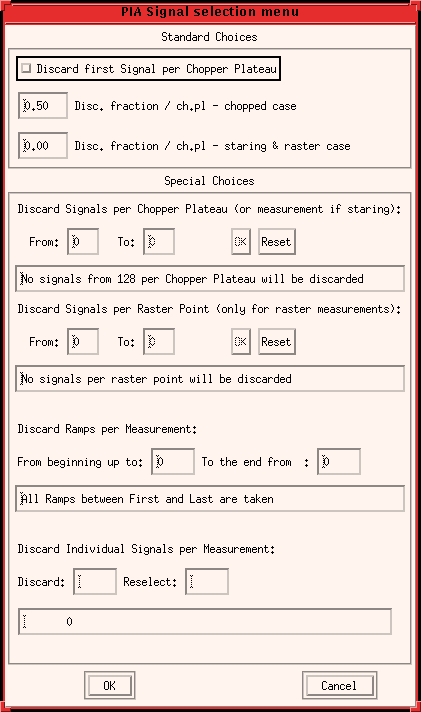
- Discard Signals: This calls the PIA Signal Selection Window in order to enter which signal values shall be discarded.
After selection the plots of the SRD Window will be refreshed with the discarded signals being marked by red crosses. Note that the selection criteria chosen remain active for all further processing steps within a session until they are modified again.They particularly affect all the pixels of the array detectors. It is not possible to set the parameters individually for each pixel or a group of pixels.
Correction
This menu bar calls a submenu for corrections to be applied to the measurement with the following options:
- Reset interval Correction: The signals show a dependence on the reset interval used for performing the observation. A correction is applied, described in section 5.2, with the values given in the Cal G files P##RESETI.FITS.
- Deglitching: This performs the deglitching on the signal level for all the pixels which belong to the measurement.
- Dark Current Subtr. (orbital dep): This performs the subtraction of the dark current. A dependency of the dark current on the orbital position has been established for the different ISOPHOT detectors. The dark current values are therefore interpolated for the computed orbital position of the measurement in analysis. The standard Cal G files used for the interpolation are P#DARK.FITS (#=P, C1,C2 or S). The subtraction can be performed either on the SRD or on the SCP level.
- Signal Linearization: This correction aims to compensate for the dependence of the detectors response on the illumination level, as described in section 5.2.
- Set RPIDs -> [1,1]: The motion of Solar System Objects (SSO) was compensated by ISO by performing a raster observation. PIA keeps the raster pointing information to make possible the investigation of possible problems by one or more raster positions. However, in the normal case, the data should be analysed as one staring observation, for obtaining the best signal to noise ratio. This button resets all raster points to [1,1] (the default for staring observation) for ignoring the raster positions.
View
This menu bar calls a submenu for obtaining the following information:
- Header Info: displays FITS header information of the corresponding measurement (including logs of the corrections performed by PIA to the data).
- Compact Status: displays information on instrument configuration present on the Compact Status file of the corresponding measurement.
- Auxiliary Files:
- IS Report: Instrument Station report recorded during the on-line monitoring of the displayed measurement (entries in PISR-FITS files).
- OLP Report: information recorded during the off-line pipeline processing of the displayed measurement (entries in the POLR-FITS files).
- EOHA: Edited Observation History Attributes corresponding to the measurement.
- EOHI: Edited Observation History Information corresponding to the measurement.
Array
This menu bar calls a submenu with additional features for array data. It offers the following option:
- Time evolution: This allows the signal values versus pixel number (for C100, C200 and PHT-S) to be viewed in one single plot:
- Time Slices: Calls a PIA Xplot Window to plot histogram of signals versus pixel number for each time step (in different colors),
- 3D View: Calls a PIA XSurface Window to plot a 3D-histogram of signals versus pixel number and time step.
Process
This menu bar calls a submenu in order to process the whole measurement to the next level. The submenu offers the following possibilities for determining the signal per chopper plateau:After a selection the processing immediately starts and the result will be displayed in a new SCP Window (s.3.3.3).
- no drift handling: just performing plain reduction of valid signals to averages and medians per chopper plateau, as described in the chapter 5 on processing algorithms: Processing to the SCP level.
- with drift handling: allows for
- a stability analysis as described in chapter 5 under Stability analysis, to discard the non-stable parts of a measurement,
- slopes variation analysis, used by the calibration scientists for accessing transients time constants,
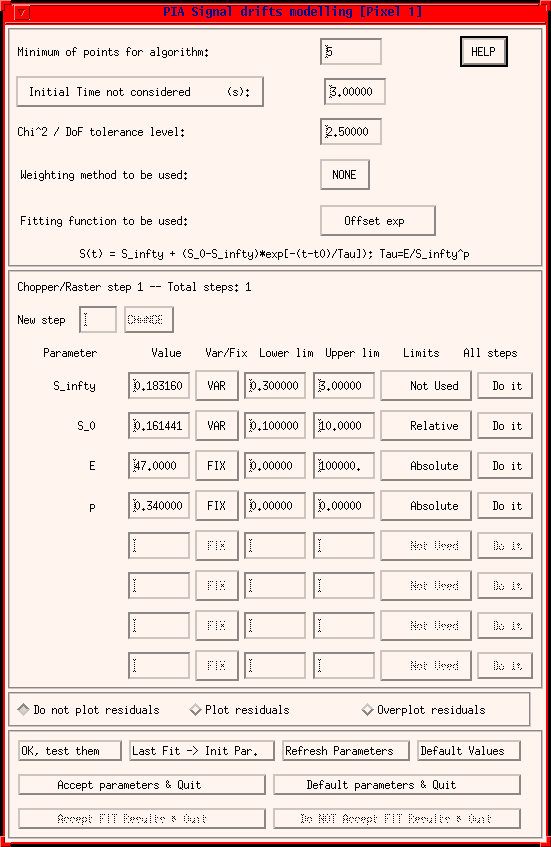
- drift modelling: fitting a model to the data for obtaining the 'true' signal per chopper plateau, as explained in the signal drifts modelling section (3.3.5).
- Special for PHT-S: dynamic calibration: PHT-S data can be under PIA alternatively reduced using the dynamic calibration method, largely explained under section 3.3.8.
- Special (but DEFAULT) for PHT-P and PHT-C chopped measurements: The "Ramps Pattern" procedure is from PIA V8.0 the default way for reducing PHT-P and PHT-C chopped measurements (not P32).
Pixels
This menu bar is active only for C100, C200 and PHT-S data, where several pixels are to be analyzed. It calls a submenu with the following options:
- Individual Choice: This calls the PIA Display Choice window. For each display window the user can specify the pixel number whose signal will be plotted. After the selection the window will be refreshed with the plots for the new pixels chosen.
- Serial Increment: This selects the next subsequent pixel to each of those shown. When pressing this button, in each window containing pixel N the signal corresponding to pixel N+1 will be plotted.
Serendipity
This button is only for serendipity survey data. Problems may occur when pressing it for standard data.N Plots
This button allows the number N of plot windows shown in the middle row of the SRD window to be selected. After a selection the window will immediately be refreshed, containing N plots. Please note that this number will be used also for further main level windows.HK
This button calls a submenu for accessing the Housekeeping Menu. The user has the choice of displaying the Housekeeping data associated only to this measurement or to the full TDT data (in the rule composed of several measurements), as contained in the corresponding GEHK FITS product.
Note: This window, displayed below, is very similar to the PIA Read-Out Selection Window. See for general description there. A special item by this window is the possibility of discarding a fixed fraction of data per chopper plateau in chopped measurements and staring / raster separately. (The tables for the corrections compensating for signal losses by chopped measurements which are not processed via the "Ramps Pattern" procedure have been derived using only the second half of each chopper plateau. therefore this selection is the default one.)
It is shown below. Please see Signal Deglitching correction in chapter 5 on processing algorithms, for an explanation of the parameters.
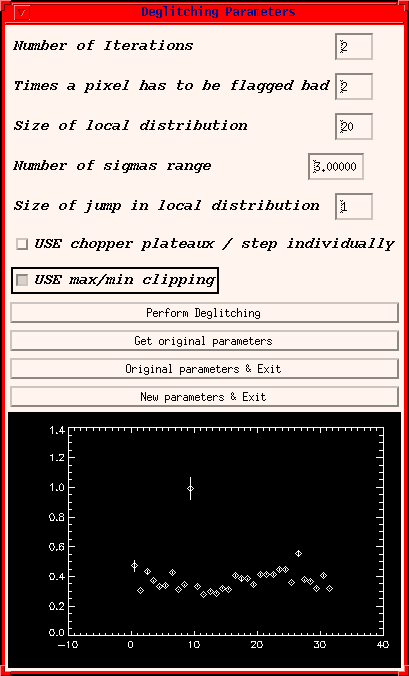
FIGURE 3: The PIA Signal Deglitching Parameters Window
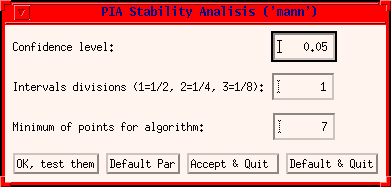
FIGURE 4: The PIA Drift Stability Analysis Window
| Date | Author | Description |
|---|---|---|
| 16/05/1996 | Martin Haas (MPIA) / Carlos Gabriel (ESA) | First Version |
| 03/09/1996 | Carlos Gabriel (ESA/VILSPA-SAI) | Update |
| 03/03/1997 | Carlos Gabriel (ESA/VILSPA-SAI) | Update |
| 6/06/1997 | Carlos Gabriel (ESA/VILSPA-SAI) | Update (V6.3) |
| 10/10/1997 | Carlos Gabriel (ESA/VILSPA-SAI) | Update (V6.5) |
| 13/02/1998 | Carlos Gabriel (ESA/VILSPA-SAI) | Update (V7.0) |
| 23/08/1999 | Carlos Gabriel (ESA/VILSPA-SAI) | Update (V8.0) |