|

|
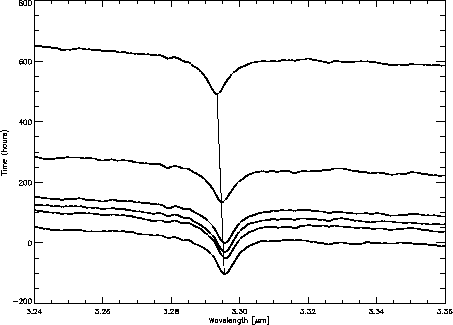
As the focal plane temperatures of ISO increased, a distinct shift in the
position of spectral features could be seen.
Fig 6.2 shows how the position of the Hydrogen
Pfund-![]() line shifts in the uncalibrated spectrum of
line shifts in the uncalibrated spectrum of ![]() Lyr.
Lyr.
To facilitate the wavelength calibration of the SWS, a fixed Fabry-Pérot is mounted in front of the internal calibration source. During the post-helium operations, a spectrum of the fringes produced by this system was observed at the beginning of every revolution when the SWS was switched on.
Each of these measurements was used to determine a wavelength calibration
of the SWS, applicable to the instrument at the time of the calibration
measurement. The wavelength calibration for a single post-helium
observation can
be calculated by interpolating these calibration parameters in time. This
results in a wavelength calibration better than 1 resolution element
(![]() /
/
![]() ) and comparable to the grating
wavelength calibration of an observation during the nominal part of the
mission (Valentijn et al. 1996, [37]).
) and comparable to the grating
wavelength calibration of an observation during the nominal part of the
mission (Valentijn et al. 1996, [37]).
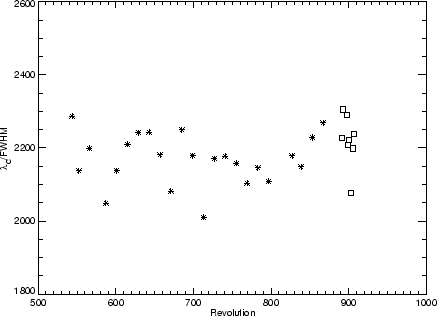
The spectral resolution as measured from the FWHM of unresolved lines in
NGC 6543 varied throughout the post-helium mission, but within the scatter of
similar measurements during the nominal mission. For the major part of the ISO
mission, this source was visited every two weeks for an SWS02 scan of selected
lines. A Calibration Uplink System (CUS) observation was
engineered to perform linescans similar to the SWS02 scanning mode. This
allowed to continue the monitoring of wavelength calibration stability and
resolution on external sources. Figure 6.3
depicts the variation of the spectral resolution
of the
unresolved H95 line at 3.297 ![]() m in the planetary nebula NGC 6543. One can
see that the resolution during the Post-Helium
Phase is not drastically different
from the values during the nominal mission (Valentijn et al. 1996,
[37]).
m in the planetary nebula NGC 6543. One can
see that the resolution during the Post-Helium
Phase is not drastically different
from the values during the nominal mission (Valentijn et al. 1996,
[37]).

|