

Next: F.3 Variable Flat-Field
Up: F. Optimising ISOCAM Data
Previous: F.1 Introduction
F.2 Long Term Transient Correction
Unlike the short term transient, no analytical or physical description
has been developed so far to correct the LTT which
seems to be a general behaviour of the ISOCAM detectors.
Here we show how to correct the LTT by a least square minimization
technique
that makes use of the spatial redundancy of raster type observations.
For a given pixel at a position  on the detector array and
at a given
time
  , the observed flux
 is related to the temporally
varying flat-field
  , the incident flux
 and the
long term drift
  by the following equation:
 |
(F.1) |
Here we suppose that  is not pixel dependent.
The offset function  is found using
equation F.1 and
the spatial redundancy inherent to raster mode observations. We determine
 by solving a set of linear equations obtained by comparing
flat-field corrected intensities of the same sky positions but obtained at
different times.
The function of interest  is estimated by
minimizing the following criterion:
Here the sum is over all the possible pixel pairs that have seen the same
region of the sky. The function  is found by solving the linear
system determined by the equation:
 |
(F.3) |
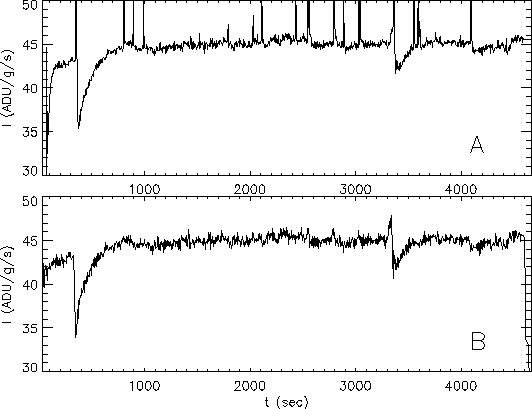
Figure F.2:
Temporal evolution of a typical pixel. A) Raw data - many
energetic electrons have hit the pixel causing instantaneous flux
steps known as fast glitches. A response change is apparent near
 seconds caused by an ion impact (slow glitch).
B) Fast glitches corrected data - short time flux steps have been
identified as glitches and removed from the data cube. The glitch
impact is removed correctly by the standard deglitching algorithm
(Starck et al. 1999a,
[58]) but the detector response is significantly
disrupted for more than 500 seconds. These glitches with a memory
effect are responsible for most of the periodic patterns seen in
Figure F.3a. Such memory effects also occur
after the observation of strong point sources.
|
|
The details of this correction can be found in
Miville-Deschênes et al. 2000, [41].
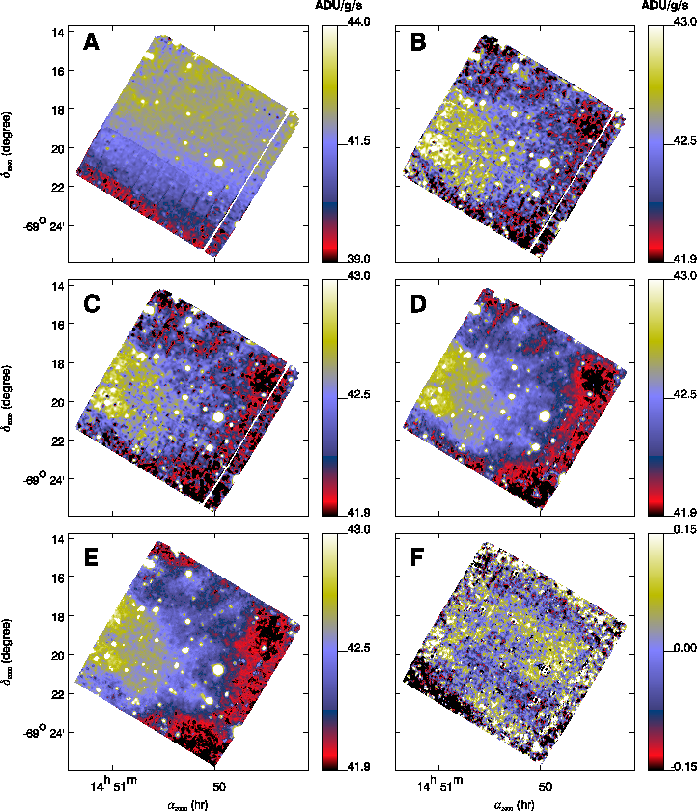
The sky image of the first GRB observation, obtained after the LTT
correction, is shown in Figure F.3b.
At this stage we have used a single flat-field to compute the sky image.
However, it is still necessary to use a variable flat-field to correct the
artefacts (e.g. periodic
patterns) seen in Figure F.3b.
Figure F.3:
LW10 images of the first GRB970402 observation after
deglitching, dark subtraction, transient correction (A), long term
transient correction (B), variable flat-field (C) and bad pixel
removal (D). Image (E) is the final map of the second GRB970402
observation and image (F) is the difference between (D) and (E).
For these observations, 1 ADU/G/s corresponds to 0.242 mJy/pix or
0.286 MJy/sr.
|
|


Next: F.3 Variable Flat-Field
Up: F. Optimising ISOCAM Data
Previous: F.1 Introduction
ISO Handbook Volume II (CAM), Version 2.0, SAI/1999-057/Dc
![]() on the detector array and
at a given
time
on the detector array and
at a given
time ![]() , the observed flux
, the observed flux
![]() is related to the temporally
varying flat-field
is related to the temporally
varying flat-field ![]() , the incident flux
, the incident flux
![]() and the
long term drift
and the
long term drift ![]() by the following equation:
by the following equation:
![]() is found using
equation F.1 and
the spatial redundancy inherent to raster mode observations. We determine
is found using
equation F.1 and
the spatial redundancy inherent to raster mode observations. We determine
![]() by solving a set of linear equations obtained by comparing
flat-field corrected intensities of the same sky positions but obtained at
different times.
by solving a set of linear equations obtained by comparing
flat-field corrected intensities of the same sky positions but obtained at
different times.
![]() is estimated by
minimizing the following criterion:
is estimated by
minimizing the following criterion:

